Showing elevation and slope on a map for cycling
Tags: QGIScornwallcyclingDTM30 Jul 2015 - MawKernewek
A while ago, I was thinking about making a map that showed elevation and slope by colour-coding. It is often conventional to show elevation with contours, or by some sort of arbitrary colour palette.
Slope is shown on a map usually by contours being closely spaced, or by arrows shown along roads in some cases. Contours can sometimes obscure map features in some cases.
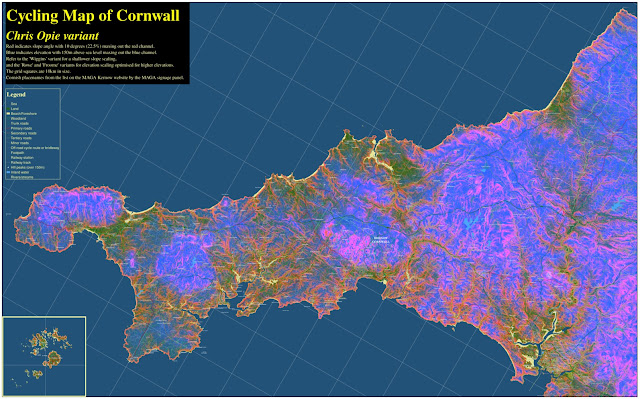
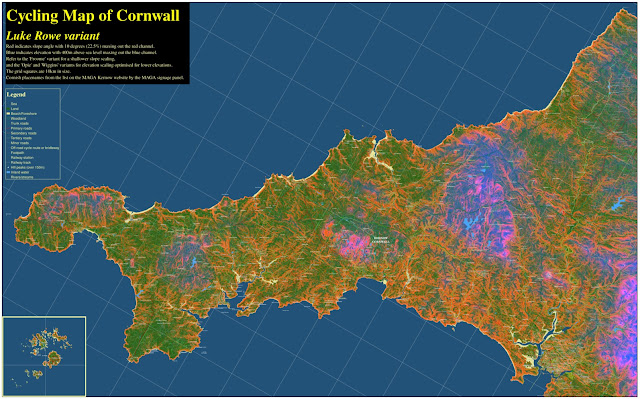
An alternative approach I have used to produce, is to colour-code both elevation and slope simultaneously in different colour channels.
In the cases below, I have used the blue band for elevation, and red for slope. Since I intended this as a map for cycling I have named the different scalings after professional cyclists.
I give a few more examples of this using a different slope scaling and downloads of larger image files on my website.

