Segmenting a DEM with RSGISLib and shading slope with lines
Tags: slope direction linesQGISRSGISLibobject-based segmentationDTM13 Aug 2015 - MawKernewek
Here I demonstrate a scheme of visualising slopes on a map using lines to indicate direction and steepness of slope.
This is not necessarily easy, because both vary continuously across a terrain.
So therefore I thought to use RSGISLib to segment a digital elevation model, that I had derived from SRTM 1 arcsec data, and used GDAL and LandSerf to create derived topographic variables and make a layerstack that consisted of 6 bands:
I told RSGISLib to use all bands except band 3 - to avoid the 360/0 discontinuity dominating the segmentation and getting a large number of segments divided along the N/S axis.
After producing the segmented DEM, then it is a matter of using RSGISLib to populate the Mean and StdDev of each band to the raster attribute table of the segment clumps file, and creating a shapefile version using gdal_polygonize and using RSGISLib to export the raster attribute table into a CSV file. There is a fair bit of scripting involved, but I was able to recycle the scripts from my MSc dissertation.
Then I load this up into QGIS, and create some styling rules to show the lines in the direction of the aspect, and thickness according to the steepness of the slope.
I added a colourisation of the elevation to display that as well. I have neglected to show a key for this, but qualitatively the colour ramp begins with a pale green becoming stronger with increasing altitude up to 200m, with yellow overlaid gradually coming in above 100m up to 300m, then orange/brown comes in up to the maximum of 420m.
Here are a couple of areas of Cornwall mapped according to this scheme. I have shown segment boundaries lightly (probably only visible on the png versions linked to in the captions) which have a minimum size of 14 pixels, where the pixel size is approximately 24m.
This is not necessarily easy, because both vary continuously across a terrain.
So therefore I thought to use RSGISLib to segment a digital elevation model, that I had derived from SRTM 1 arcsec data, and used GDAL and LandSerf to create derived topographic variables and make a layerstack that consisted of 6 bands:
- Elevation above sea level (m)
- Slope (degrees)
- Aspect (degrees)
- magnitude of Aspect away from N (degrees) - to avoid the 360/0 discontinuity
- Cross-sectional curvature
- Longitudinal curvature
I told RSGISLib to use all bands except band 3 - to avoid the 360/0 discontinuity dominating the segmentation and getting a large number of segments divided along the N/S axis.
After producing the segmented DEM, then it is a matter of using RSGISLib to populate the Mean and StdDev of each band to the raster attribute table of the segment clumps file, and creating a shapefile version using gdal_polygonize and using RSGISLib to export the raster attribute table into a CSV file. There is a fair bit of scripting involved, but I was able to recycle the scripts from my MSc dissertation.
Then I load this up into QGIS, and create some styling rules to show the lines in the direction of the aspect, and thickness according to the steepness of the slope.
I added a colourisation of the elevation to display that as well. I have neglected to show a key for this, but qualitatively the colour ramp begins with a pale green becoming stronger with increasing altitude up to 200m, with yellow overlaid gradually coming in above 100m up to 300m, then orange/brown comes in up to the maximum of 420m.
Here are a couple of areas of Cornwall mapped according to this scheme. I have shown segment boundaries lightly (probably only visible on the png versions linked to in the captions) which have a minimum size of 14 pixels, where the pixel size is approximately 24m.
Truro/Falmouth area
 |
| A larger version, showing a wider area including Redruth/Camborne (14MB PNG). |
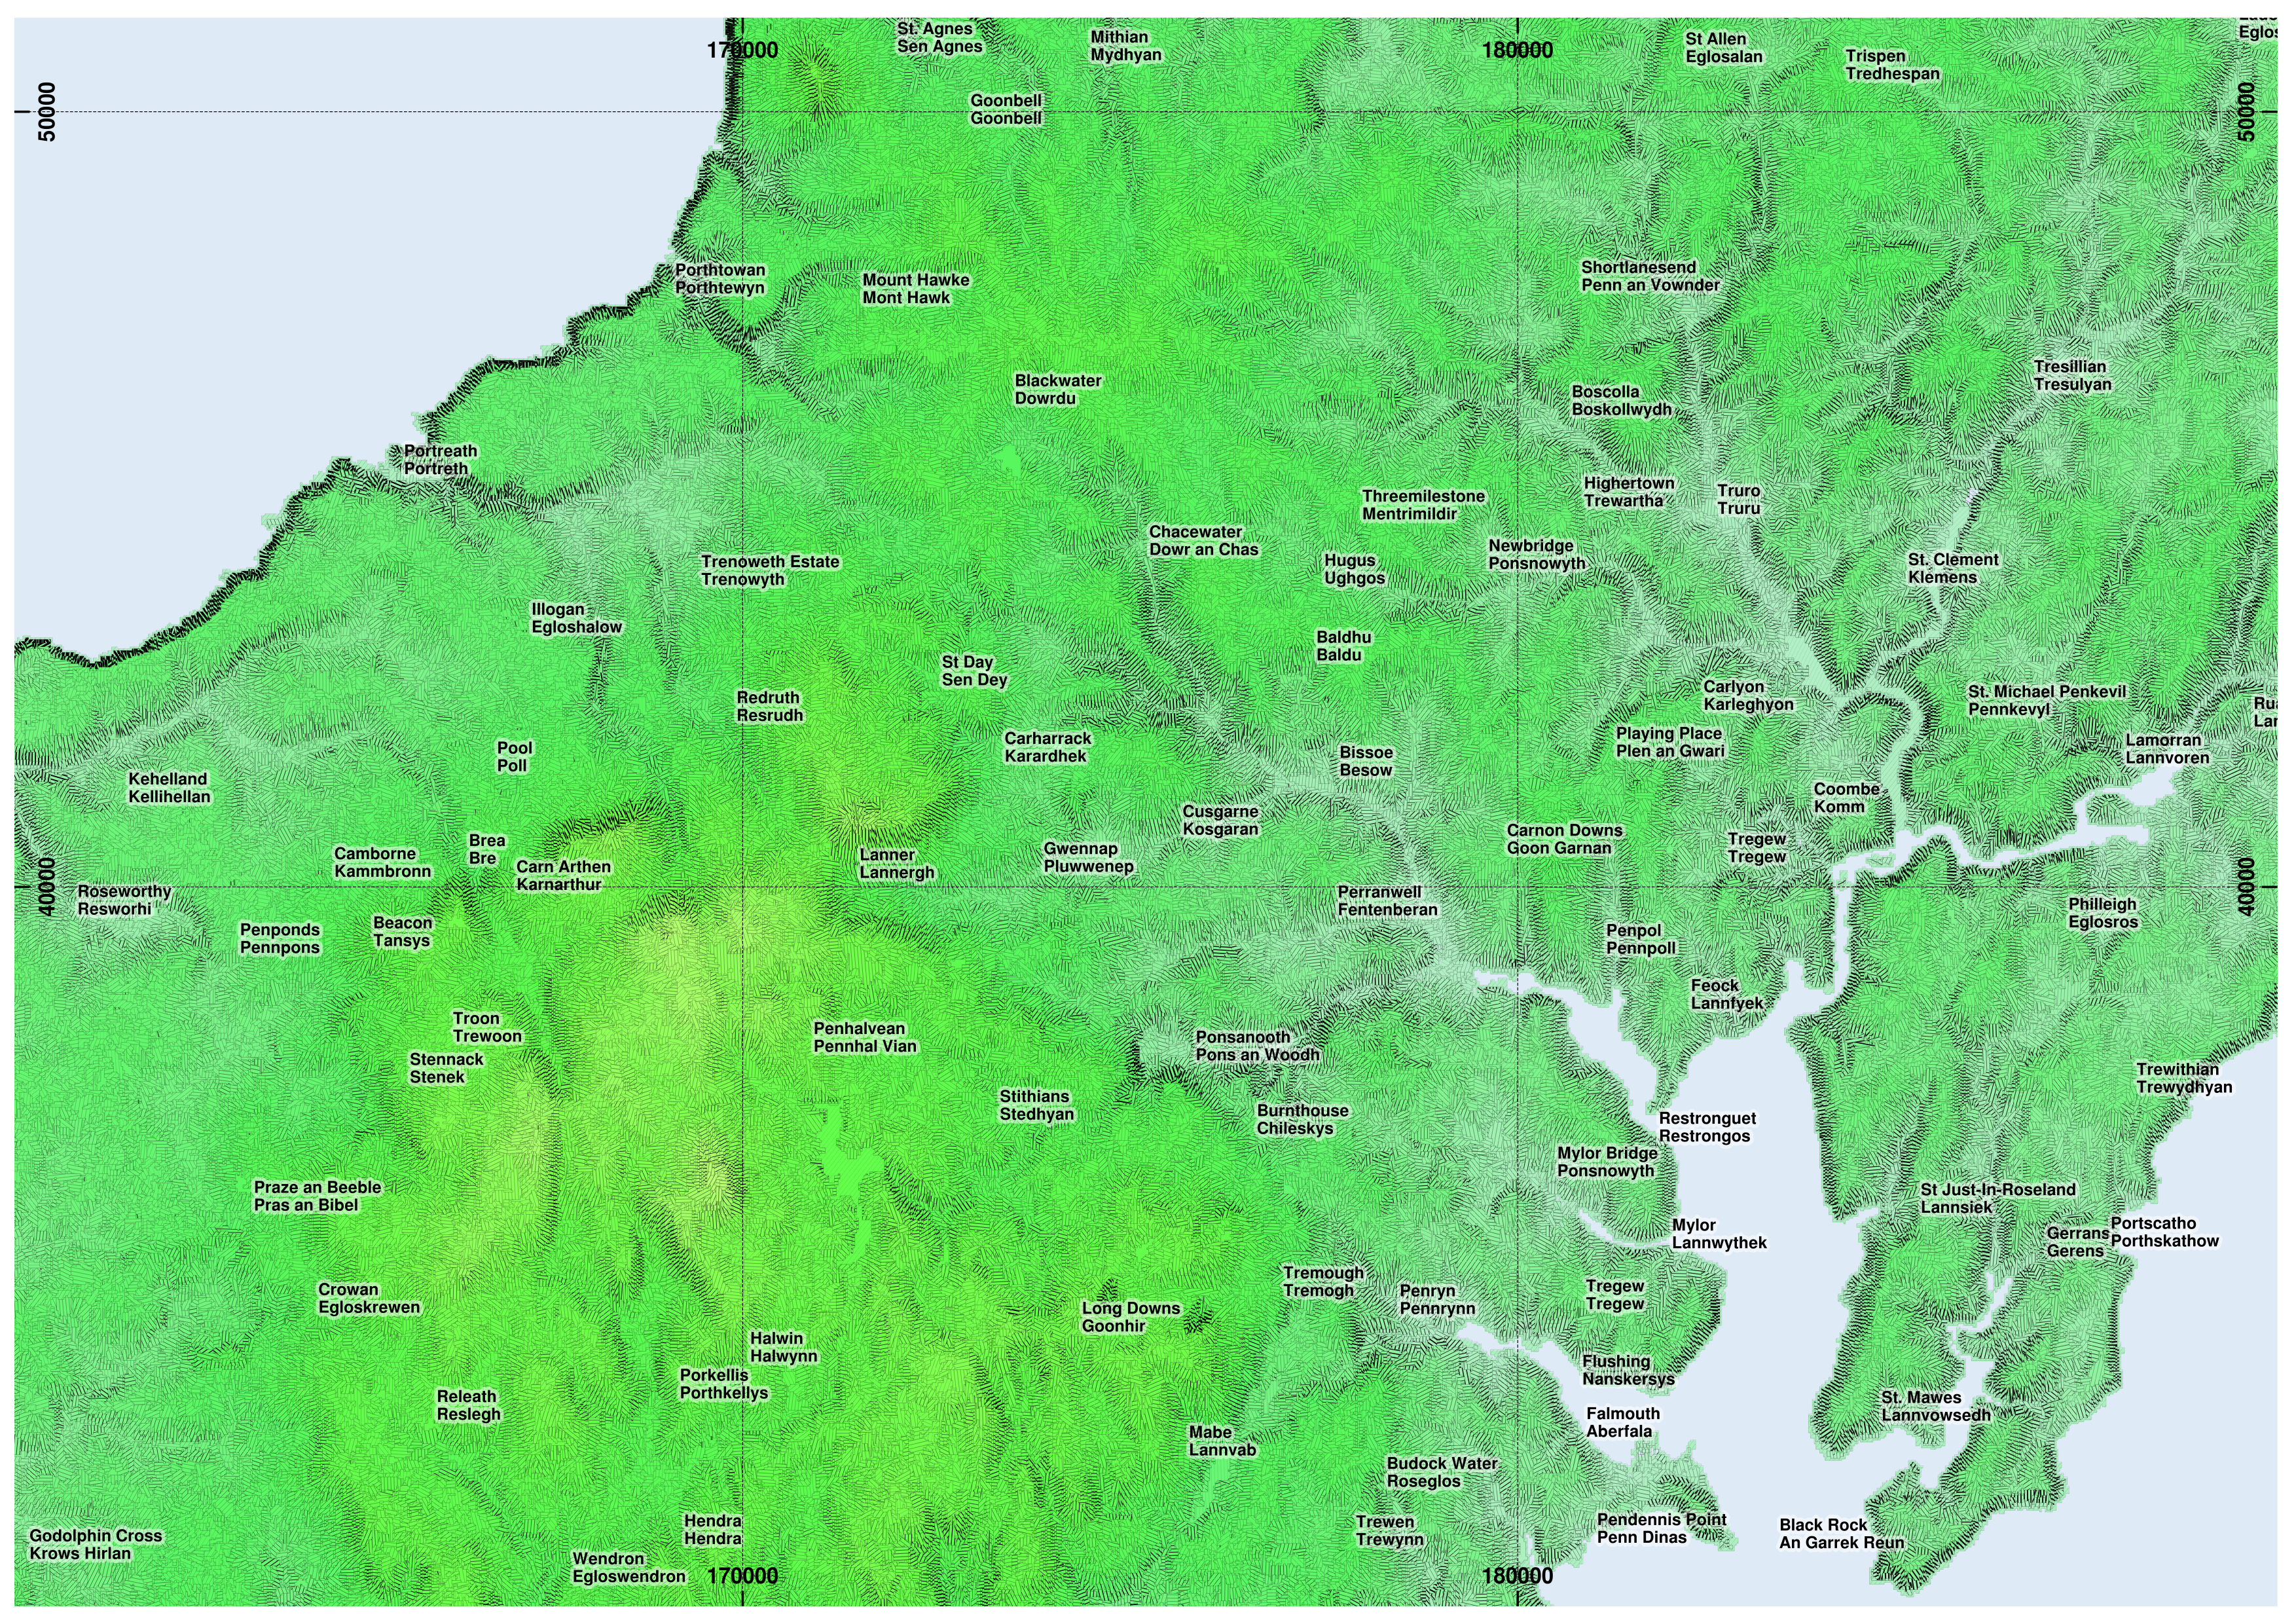
Part of N coast and Bodmin Moor
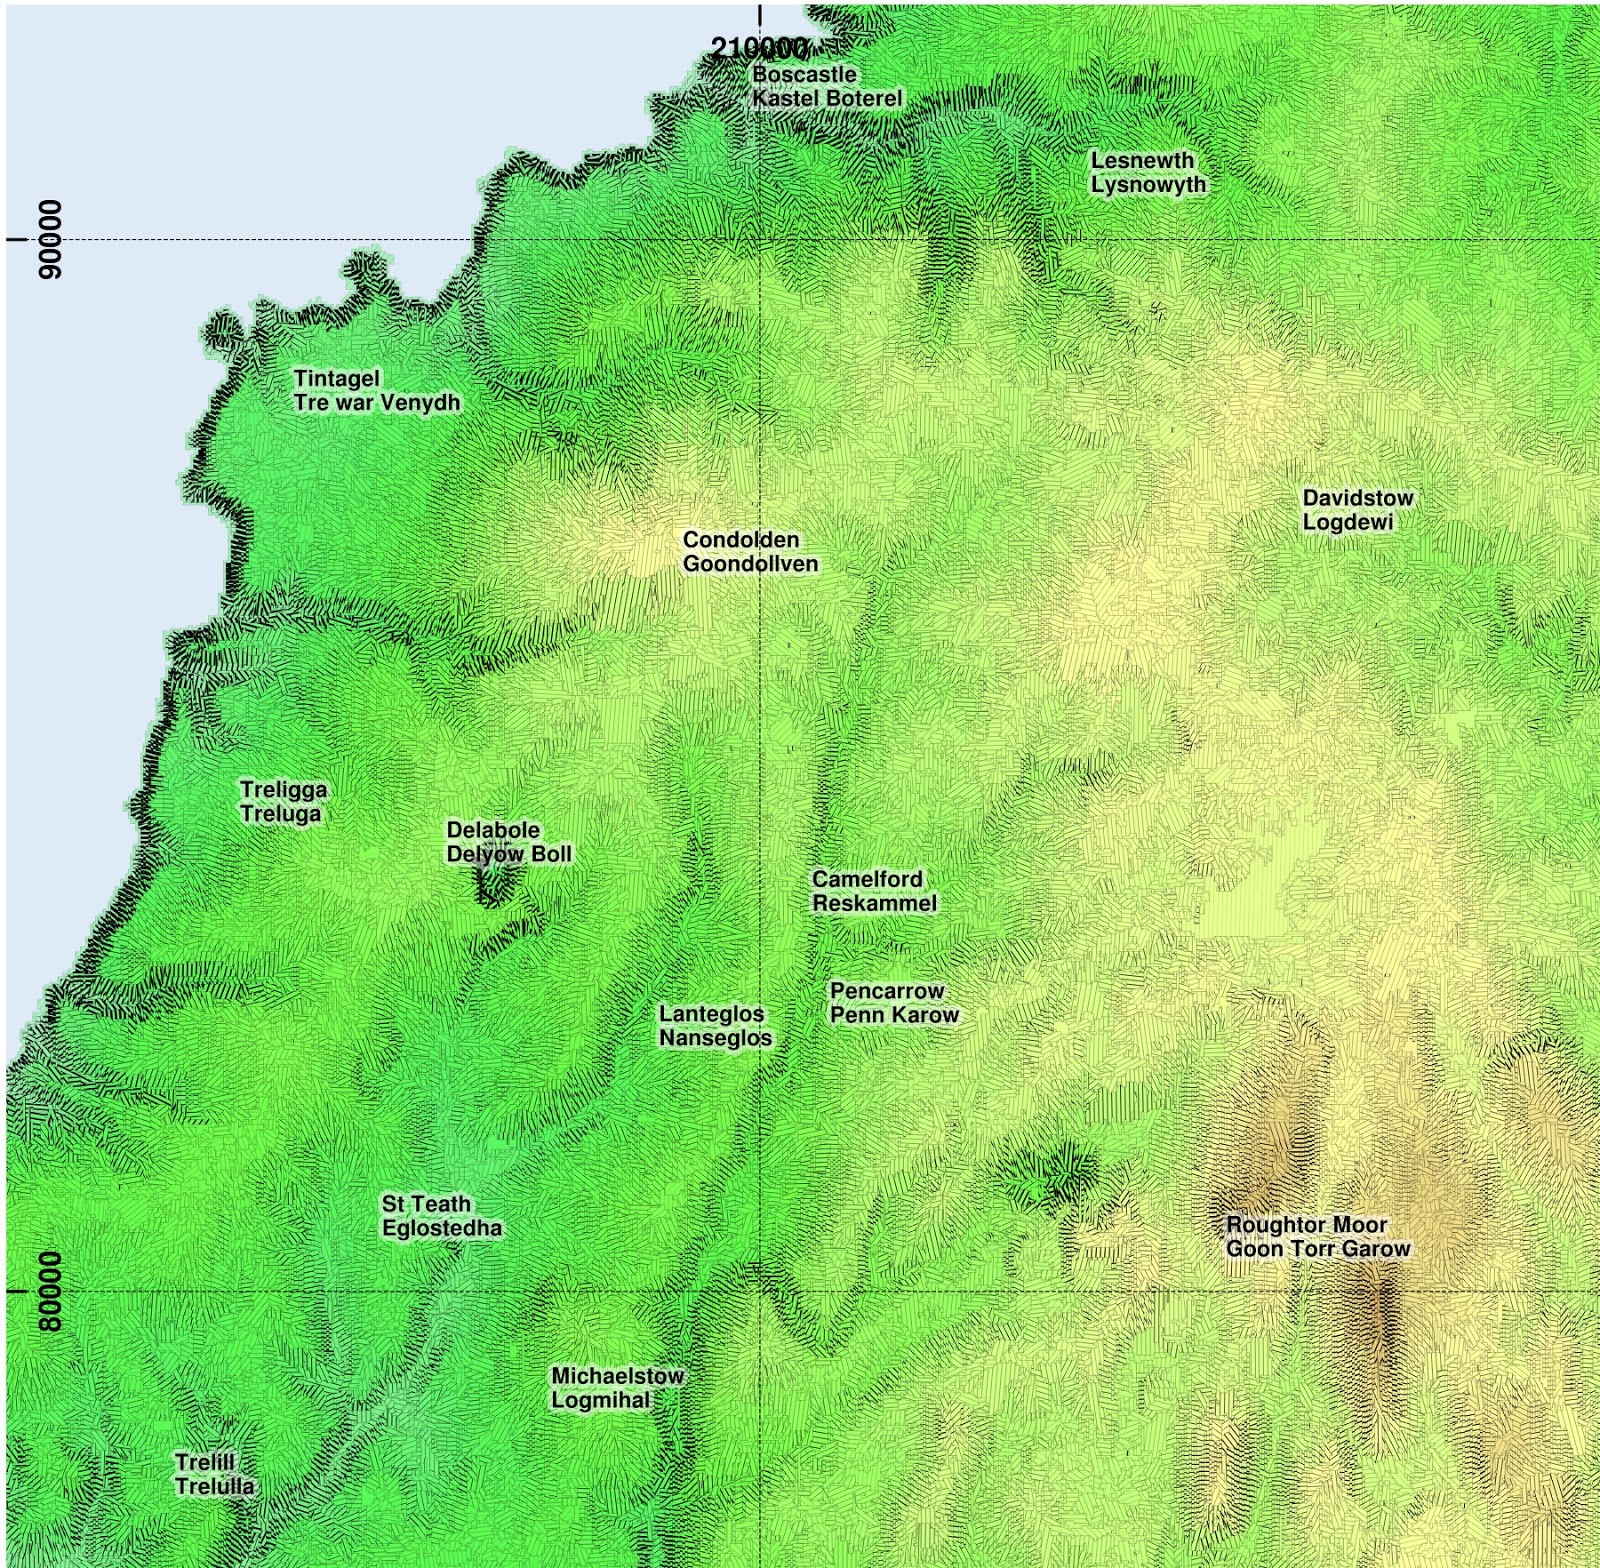 |
| A larger version, showing a wider area (16MB PNG). |
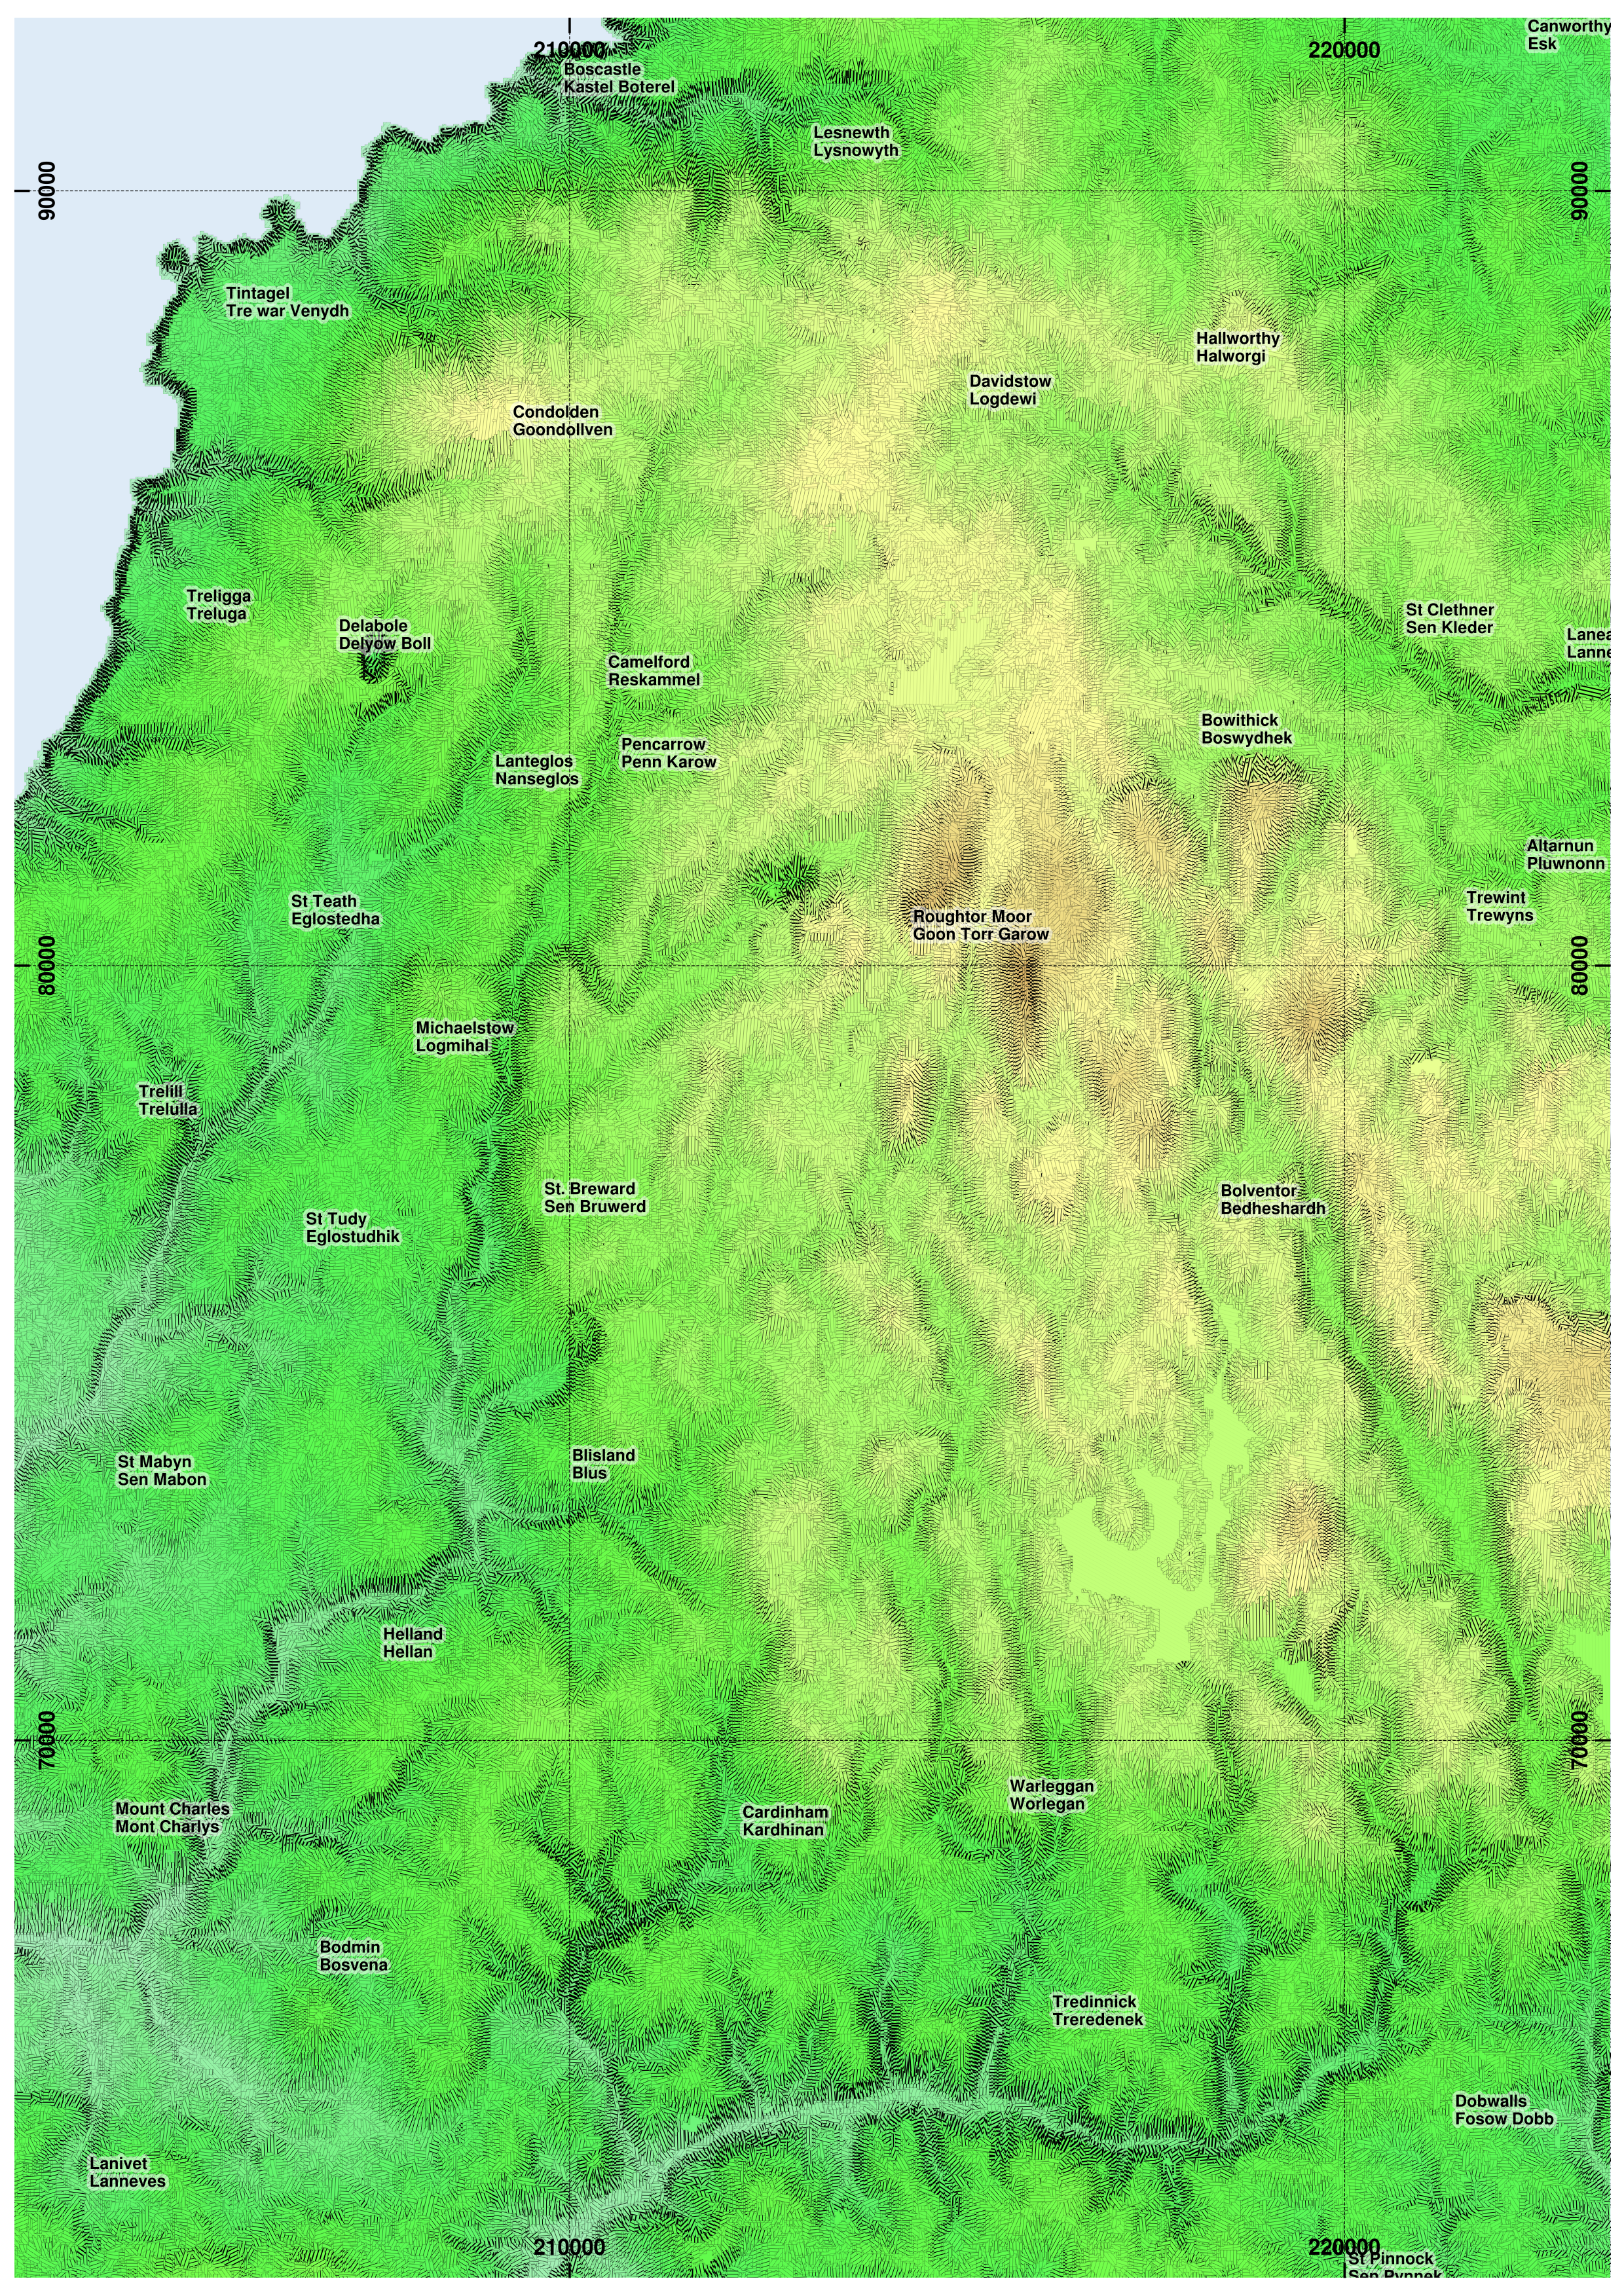
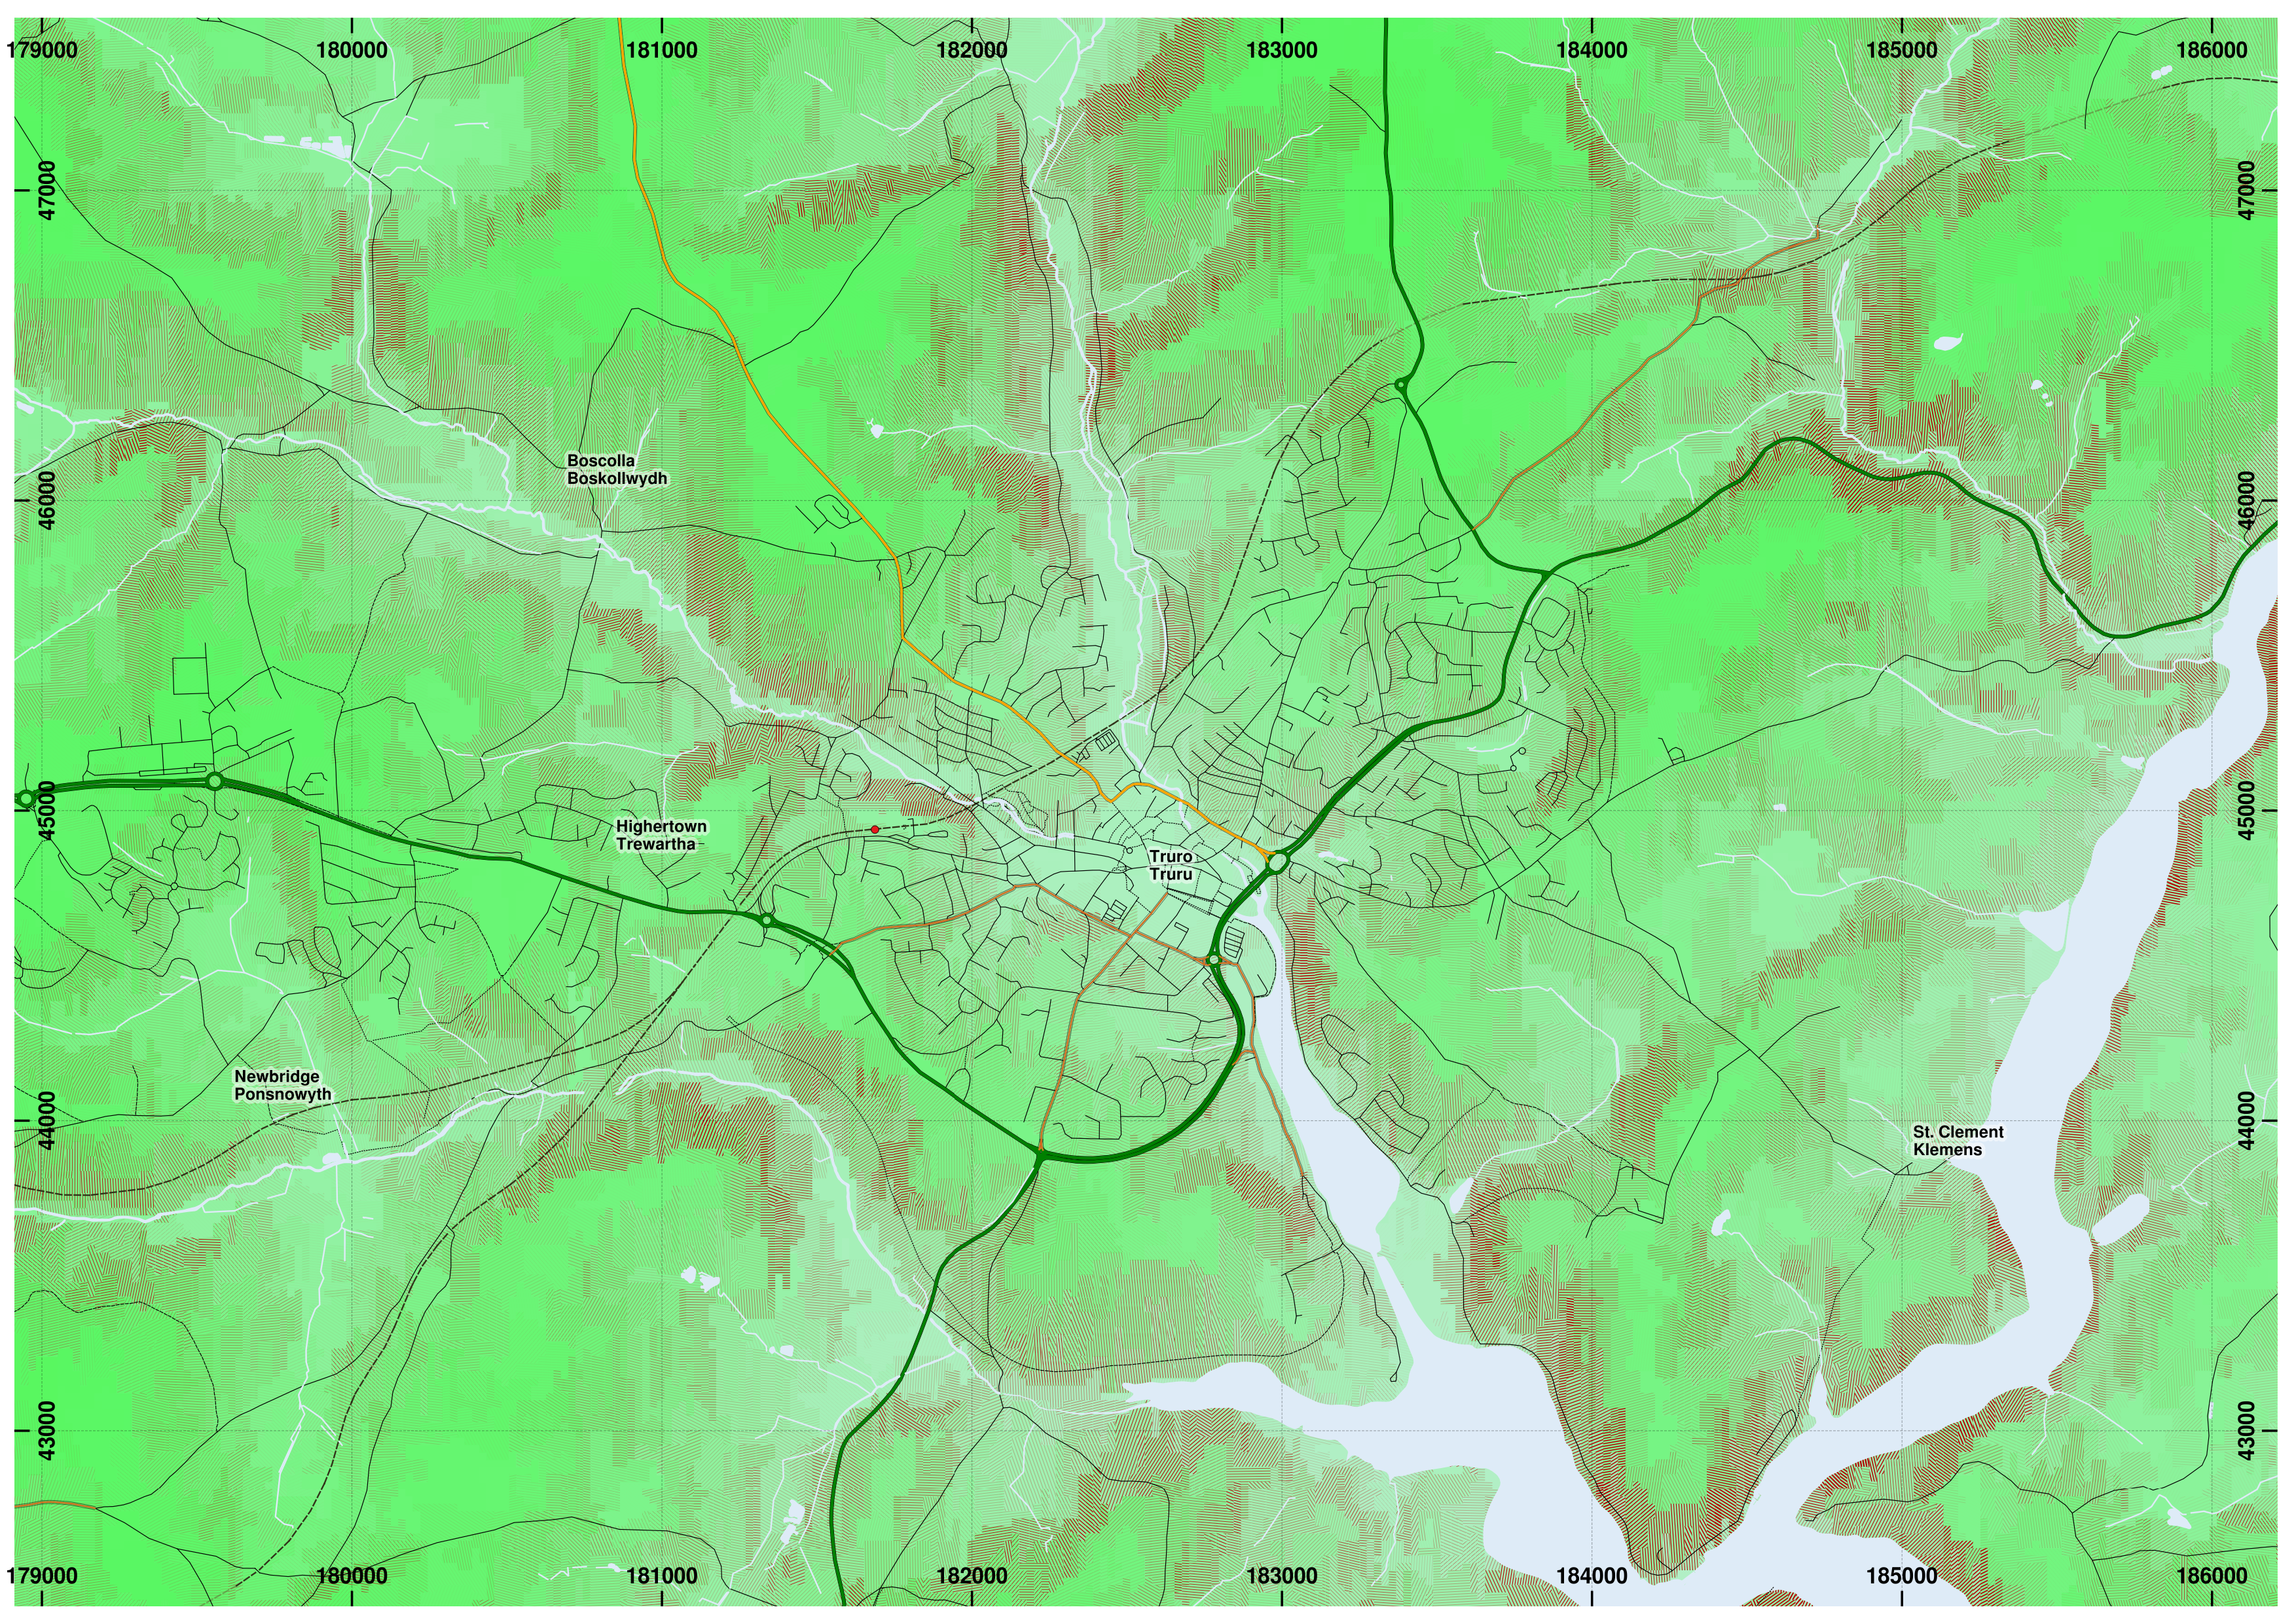
Close up of Truro area, rendered at 1:25000
Here is a version, with the roads added from OpenStreetMap, and inland and tidal water added from OS VectorMap, rendered at 1:25k with a modified spacing of slope lines which now are removed entirely where the mean slope in a segment is less than 2.25 degrees (1 in 20), and plotted in a shade of red in an effort to avoid confusion with minor roads. The segment boundaries are also no longer plotted.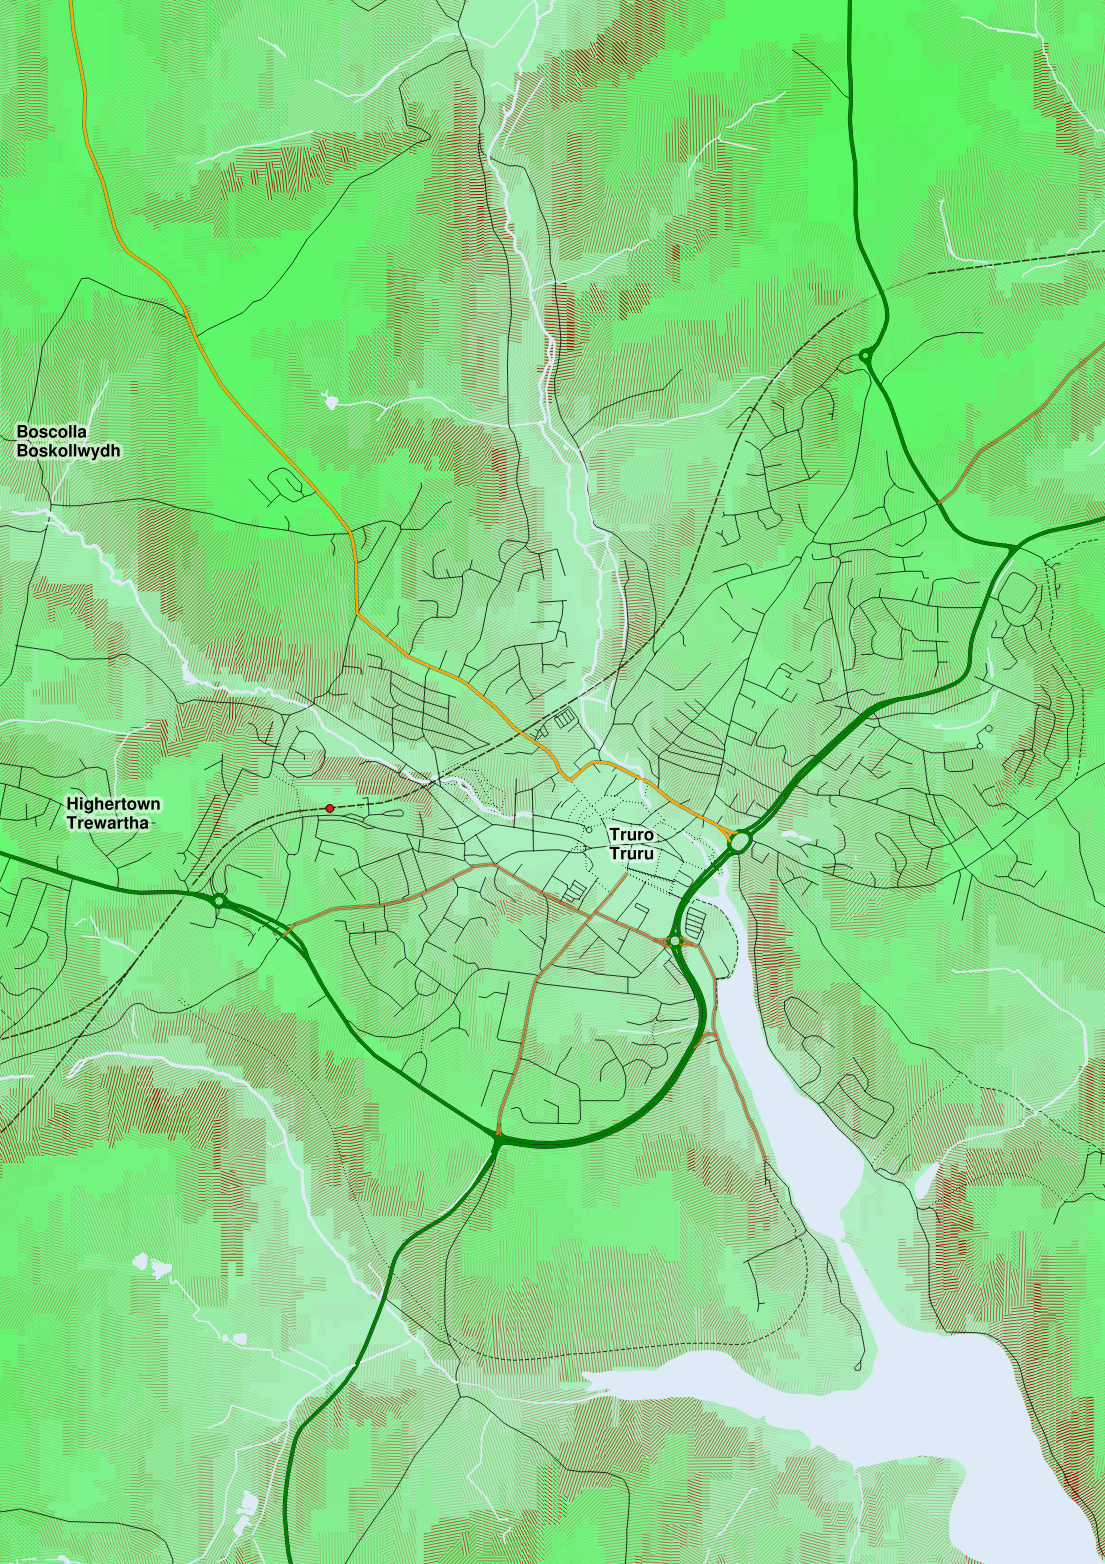 |
| A larger version, rendered at a higher resolution, covering a somewhat wider area (7.6MB PNG). |
Redruth, and the north face of Carn Brea
 |
| The elevation scale is modified such that darker green is lower in this rendering, moving to light green, through yellow and then orange as before. The north face of Carn Brea shows areas of steep slope, which can sometimes suffer from gorse fires. |