In the segmentation discussed in the previous two posts, as well as mean elevation, slope and aspect, I also have two curvature layers, longitudinal, and cross-sectional curvature that I calculated in
LandSerf. The definitions of these are explained in the
PhD thesis of Jo Wood, the author of LandSerf.
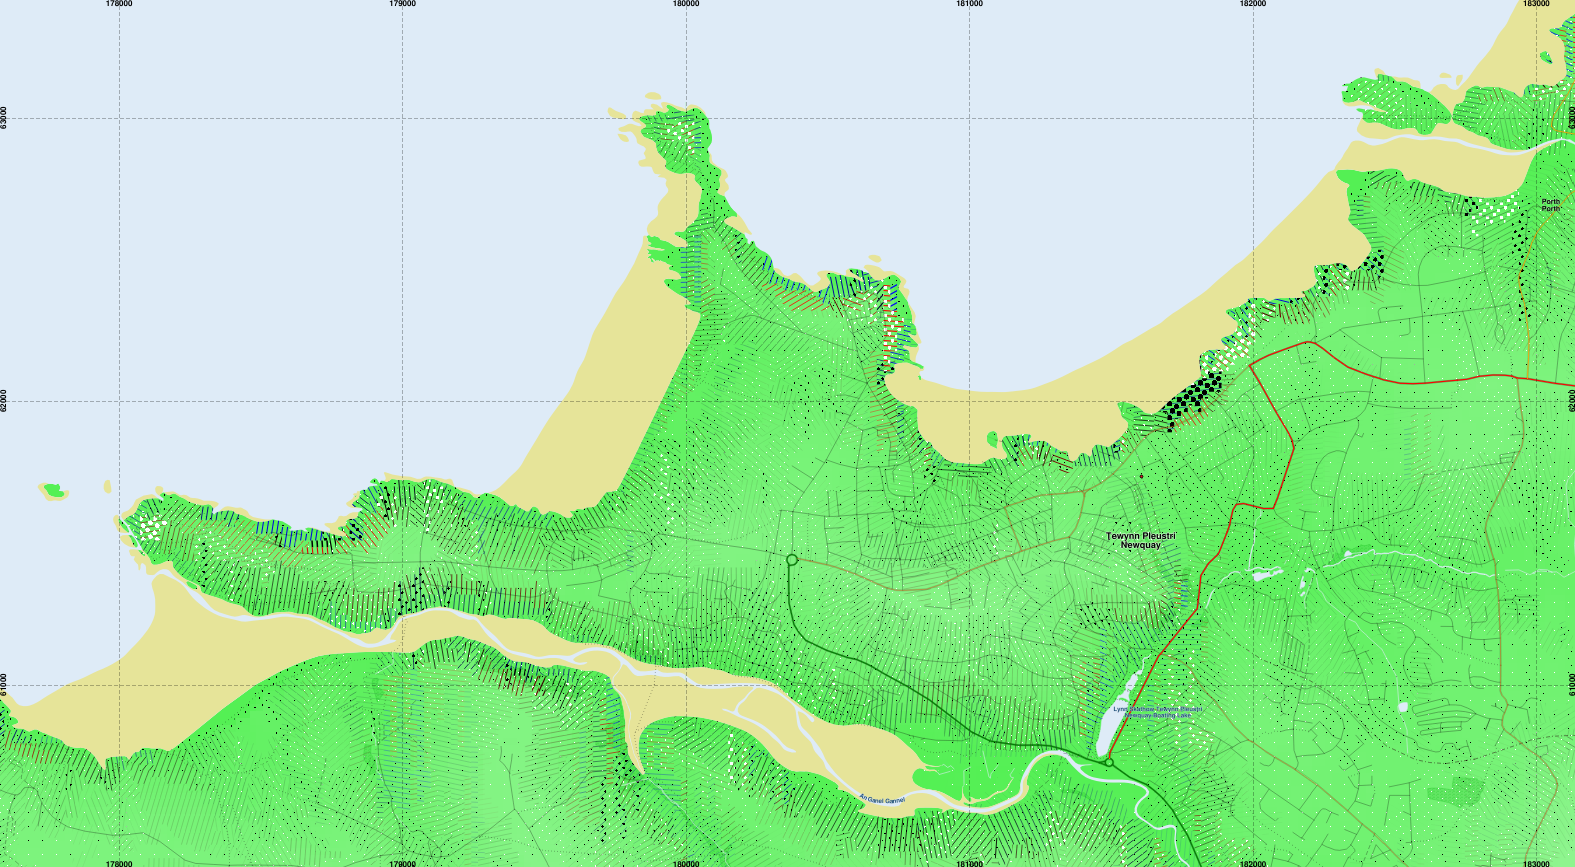
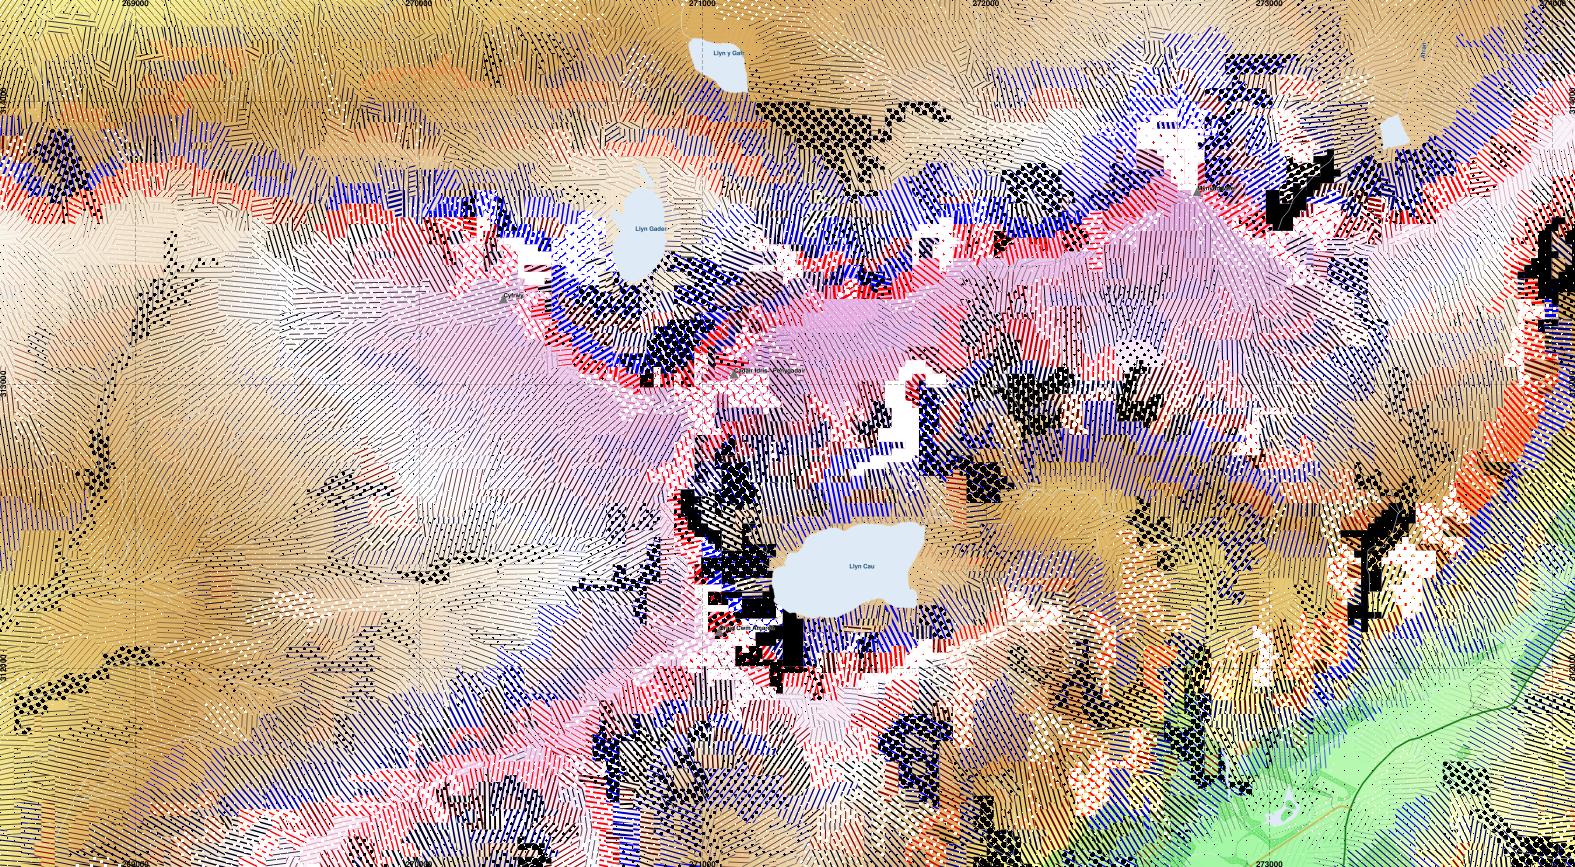
I thought to indicate longitudinal curvature using colour, shading convex slopes in red and concave in blue. Cross-sectional curvature is indicated with dots, which are white for diverging slopes and black for converging. Both of these are normalised by the square root of the segment area relative to the minimum segment area.
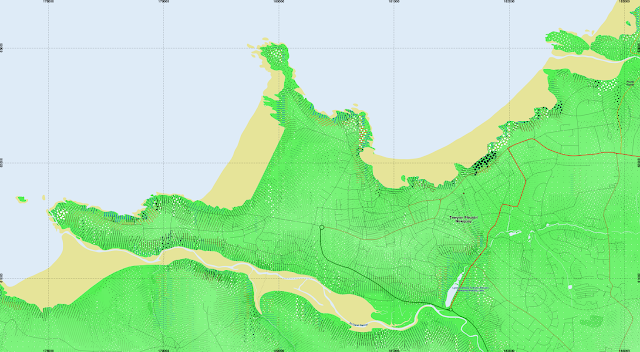 |
| Newquay in Cornwall. Convex slopes appear in red, concave in blue. |
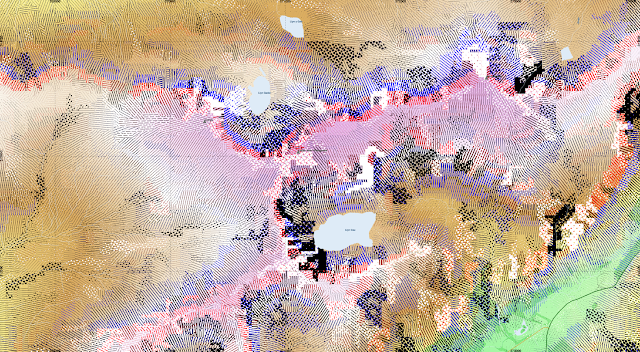 |
| Cadair Idris. Some strongly curved areas create very large dots that fill entire segments above Llyn Cau |
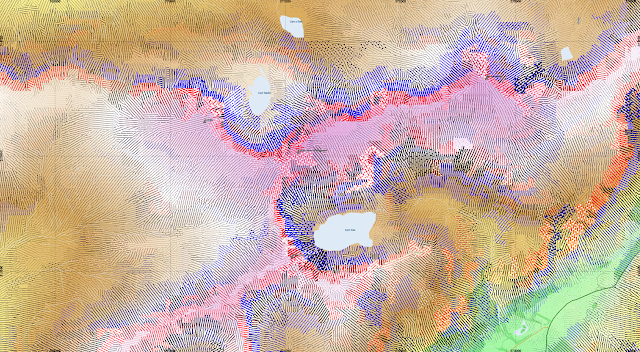 |
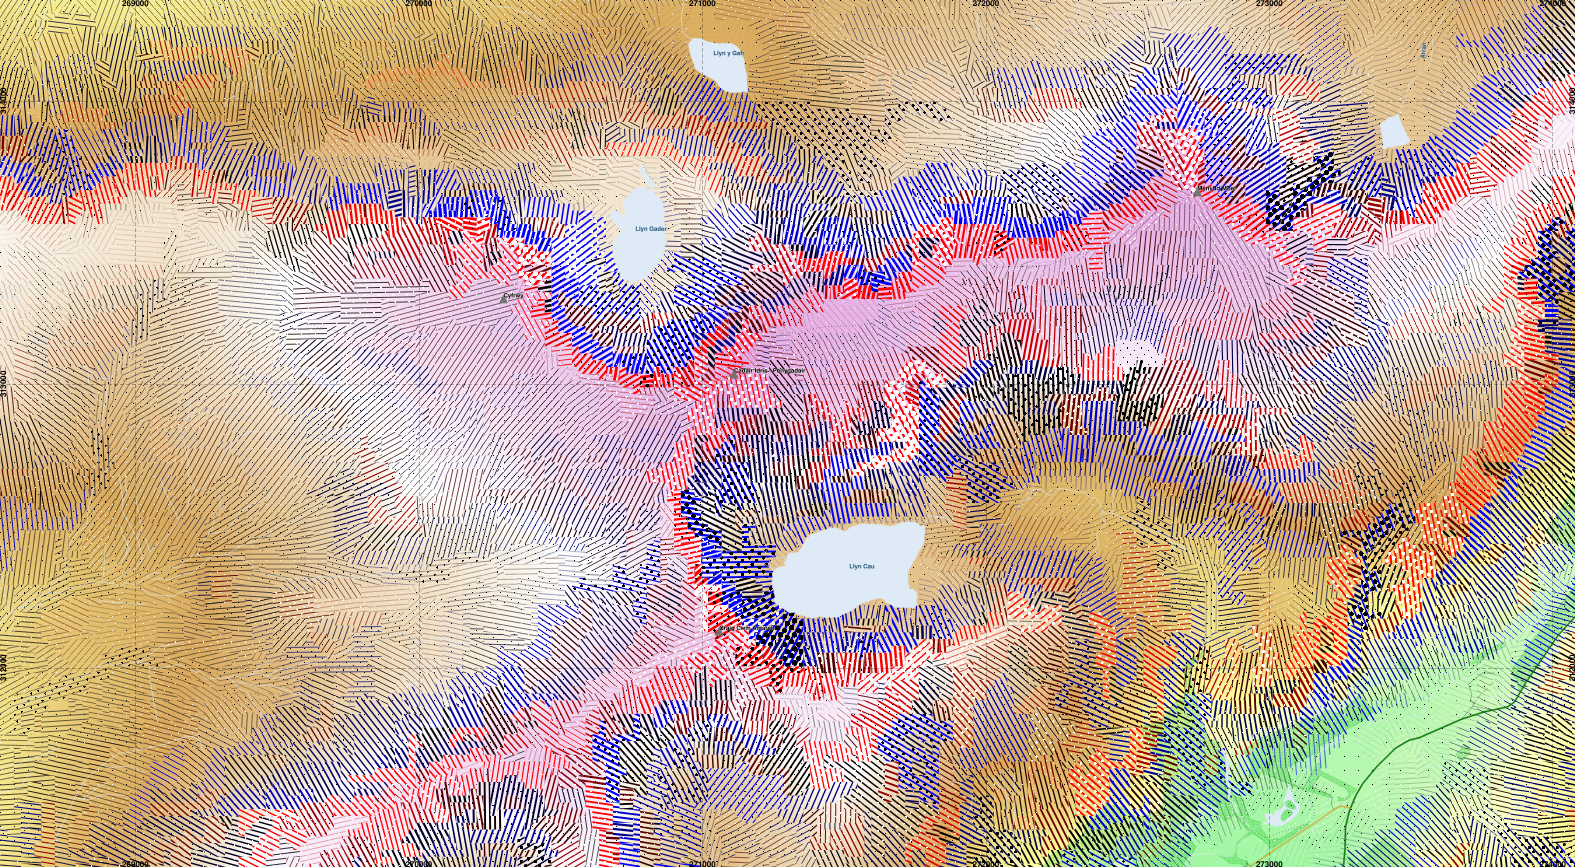
| Rescaling the dots to half their radius. |
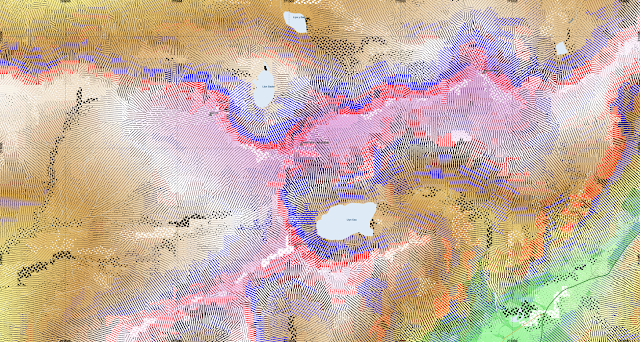 |
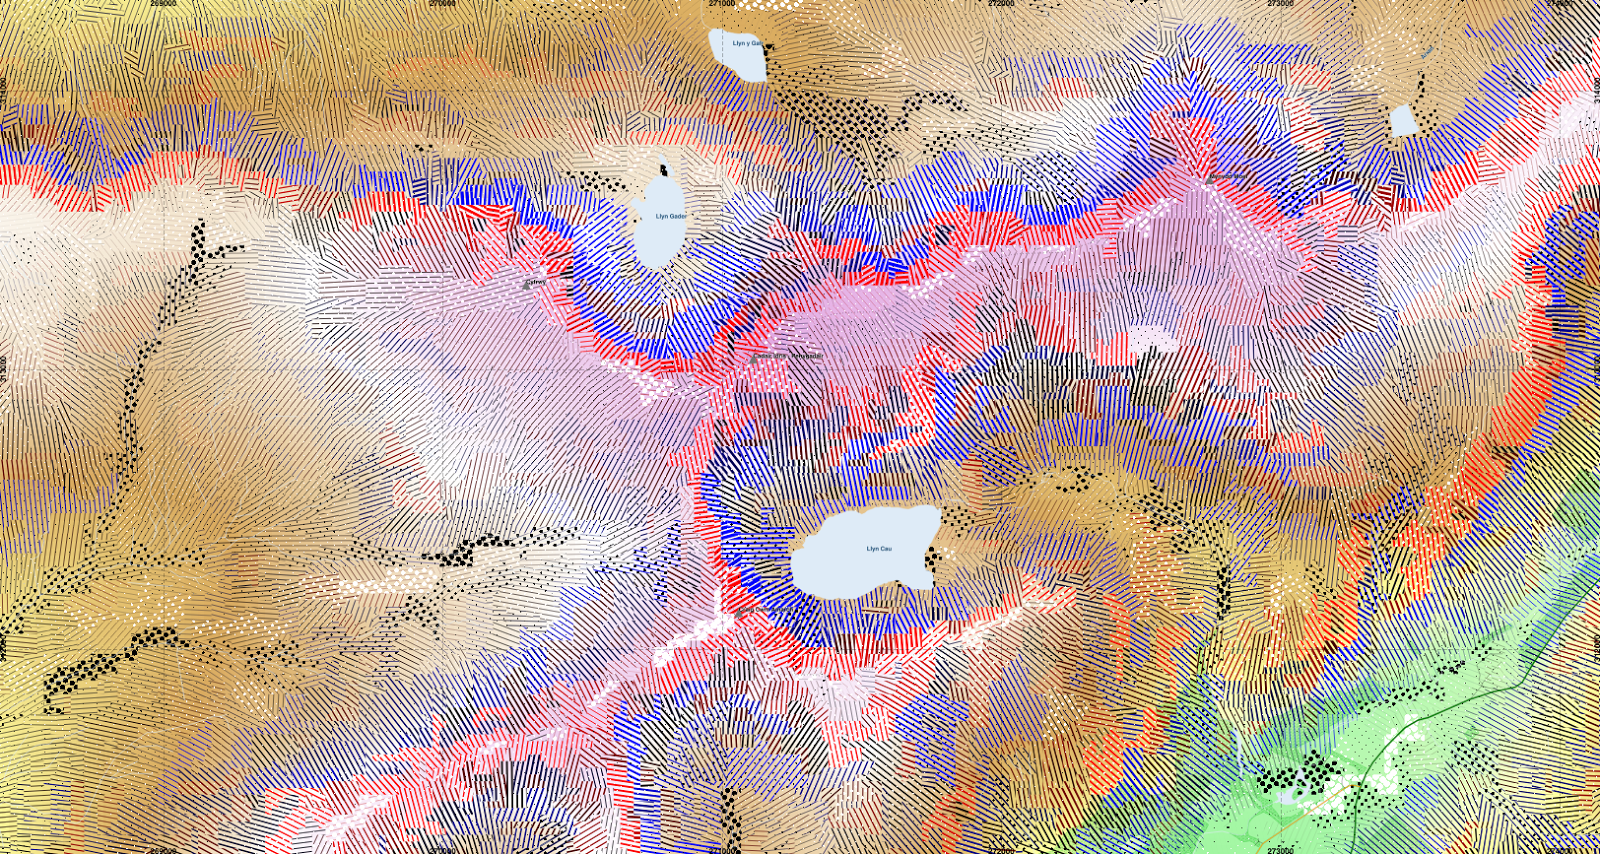
| Normalising the radius of the dots by the slope. i.e. reduce dots on steep slopes, and expand those on flatter terrain, such that they are scaled by the magnitude of the cross-sectional curvature relative to the slope. It does get a bit complicated, with the formula for their size in QGIS being "case when RAT_CrScCrv_Mean > 0 then 5*(90/max(RAT_slope_deg_Mean,1))*RAT_CrScCrv_Mean*(sqrt($area/(14*24*24))) else -5*(90/max(RAT_slope_deg_Mean,1))*RAT_CrScCrv_Mean*(sqrt($area/(14*24*24))) end" |