The Bayesian classifier function in the dissertation - Part 3: Segmenting the layerstacked feature vector
Tags: dissertationMars04 Jan 2016 - MawKernewek
In the previous post, I made an aside to mention what I did to create shapefiles of the Souness glacier-like-form extents.
Now I will mention the actual segmentation of the layerstacked feature vector.
The RSGISlib function that performs the segmentation is described on the RSGISlib website at www.rsgislib.org/rsgislib_segmentation.html.
I wrote a wrapper script around it to perform the segmentation itself, setting the smallest size of segments at 0.2 square kms. I calculate the number of pixels that is depending on the DTM resolution. This can be extracted via the gdalinfo command-line script.
One detail is that I added 9999 to all fields before using the segmentation, since the segmentation didn't work properly with negative values, which are encountered in Martian DTM data, and also in the DTM curvature fields.
There is a subtlely not mentioned in the above flowchart, is that I add the statistics from the original image file (i.e. without the +9999) to the clumps file from the segmentation to the RAT table.
In one version of RSGISLib, it didn't include the objectID in the raster attribute table, which I then added back in manually with a Python script.
The gdal_polygonize command takes the segment clumps file and makes it into shapefile polygons.
Now I will mention the actual segmentation of the layerstacked feature vector.
 |
| A figure from my dissertation showing the process of segmenting the layerstacked feature vector with RSGISlib, then using gdal_polygonize to convert this to a shapefile, and extracting the Raster Attribute Table as a .csv file, to which further processing can be done before rejoining the shapefile with it in QGIS. |
I wrote a wrapper script around it to perform the segmentation itself, setting the smallest size of segments at 0.2 square kms. I calculate the number of pixels that is depending on the DTM resolution. This can be extracted via the gdalinfo command-line script.
One detail is that I added 9999 to all fields before using the segmentation, since the segmentation didn't work properly with negative values, which are encountered in Martian DTM data, and also in the DTM curvature fields.
There is a subtlely not mentioned in the above flowchart, is that I add the statistics from the original image file (i.e. without the +9999) to the clumps file from the segmentation to the RAT table.
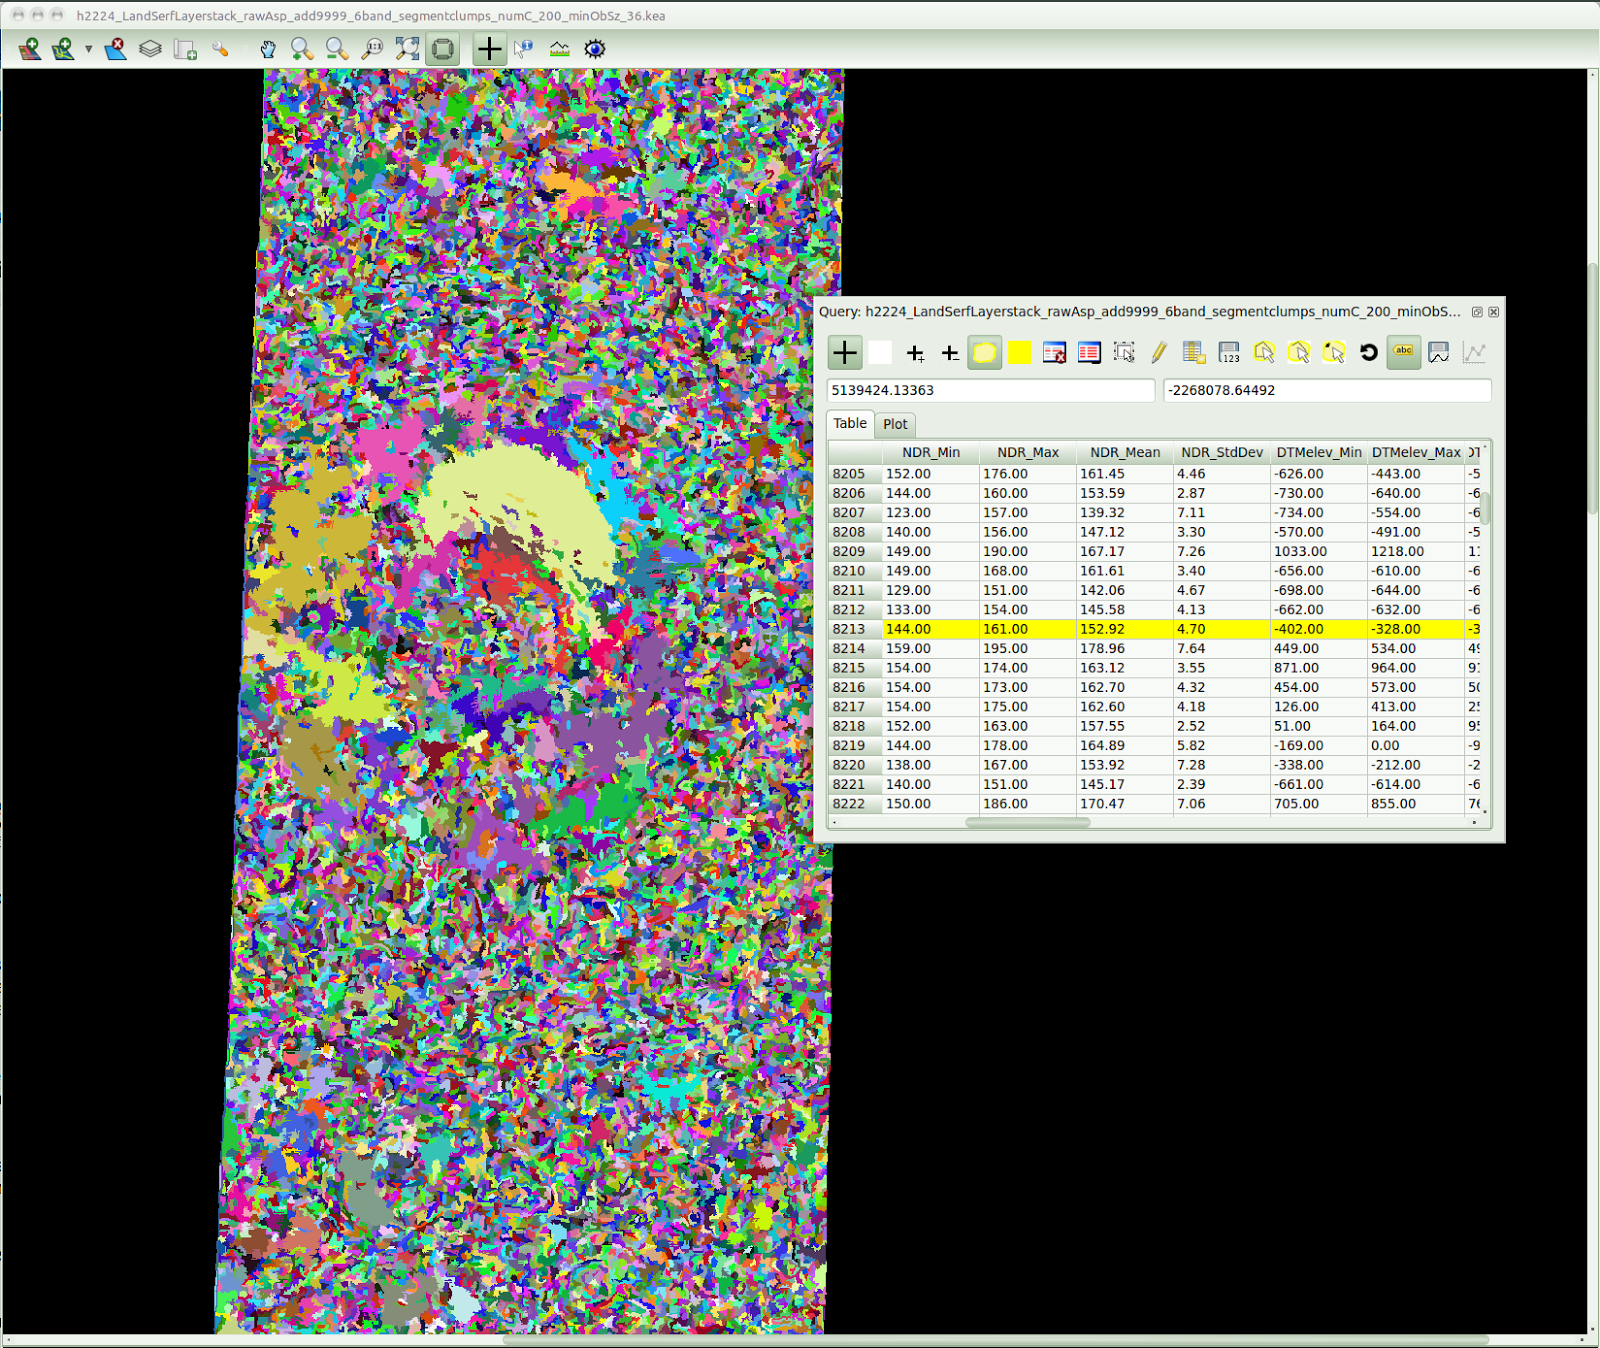 |
| Clumps file in TuiView for tile h2224 covering Greg crater, after the addition of the clump statistics to the RAT. |
In one version of RSGISLib, it didn't include the objectID in the raster attribute table, which I then added back in manually with a Python script.
The gdal_polygonize command takes the segment clumps file and makes it into shapefile polygons.