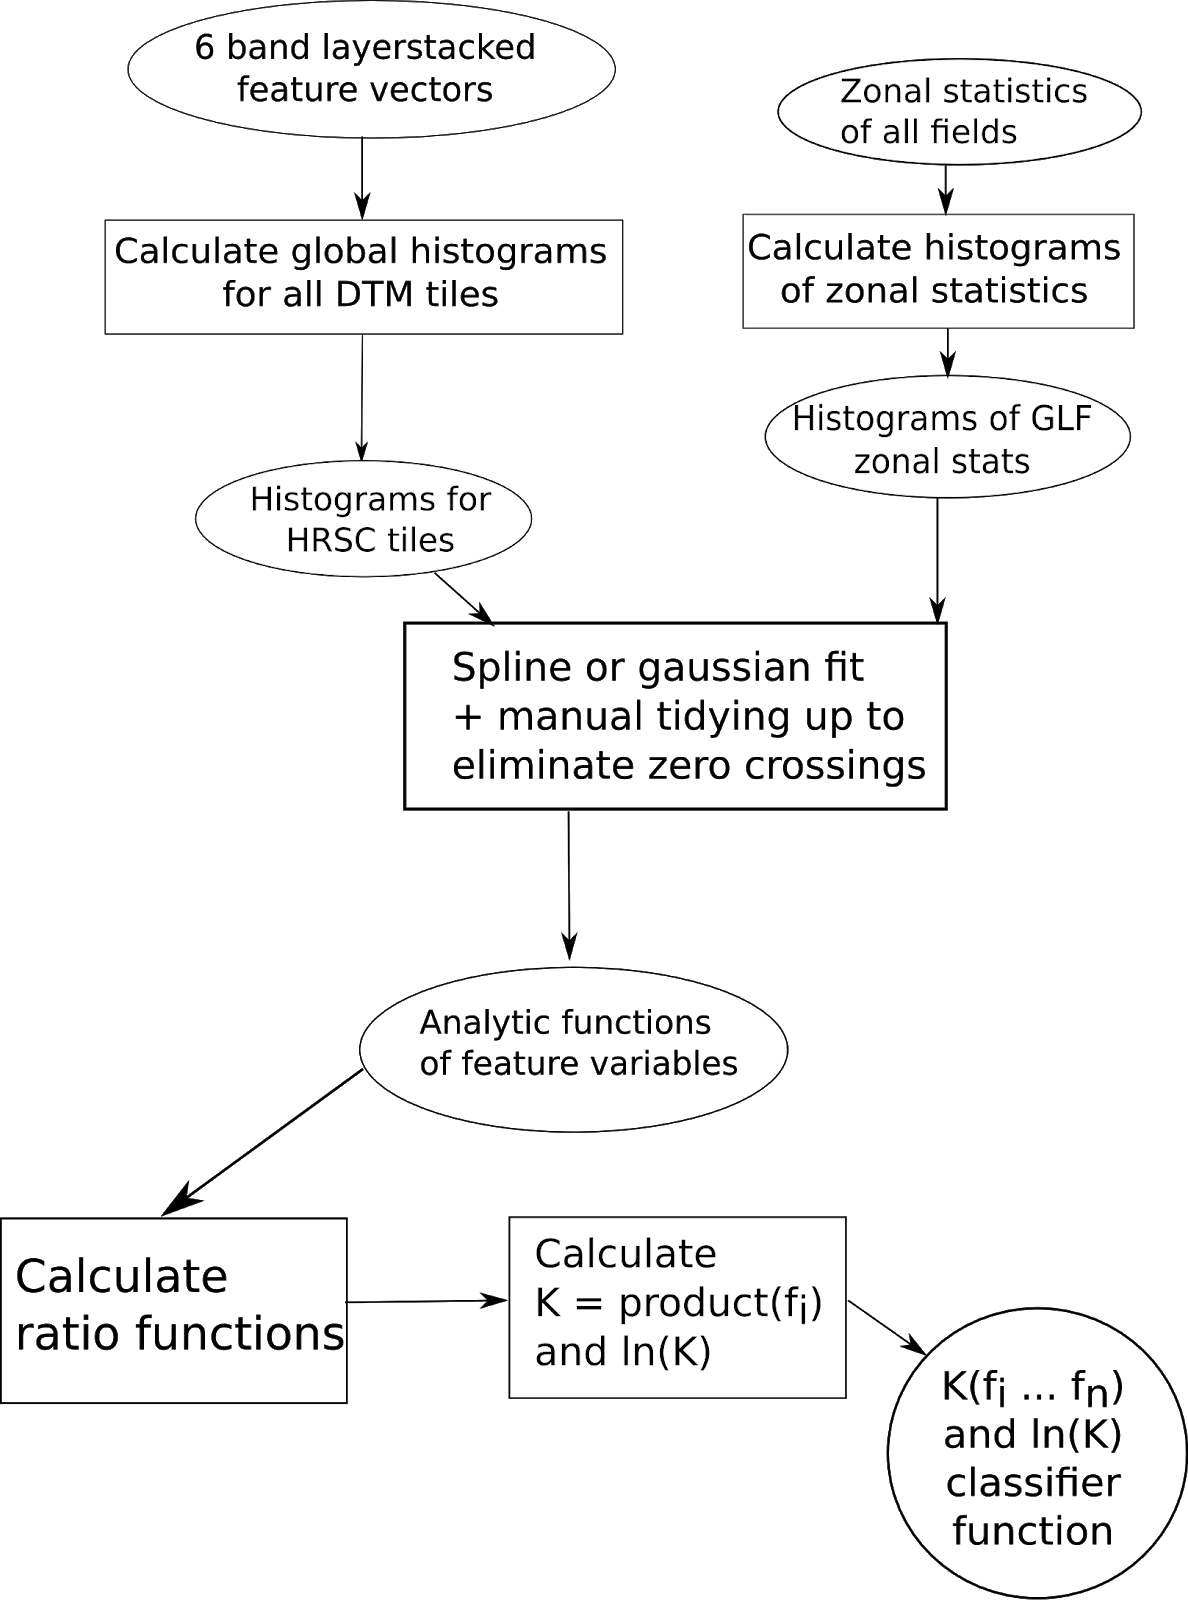
I made global histograms for all of the HRSC DTM tiles of the feature vector (NDR, DTM, slope, Asp, LgtCrv, CrsCrv) , and also histograms for the zonal statistics (I did this for 'head' areas, 'extent' areas and 'context' areas.)
Histograms for zonal statistics for 'extent' shapefile polygons:

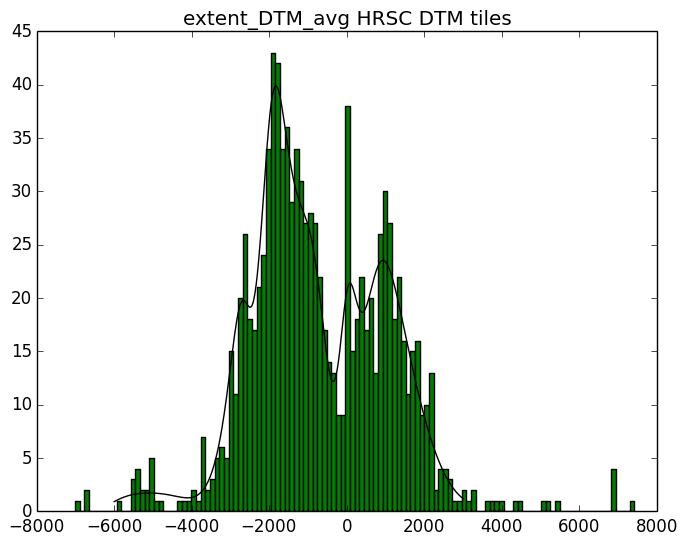
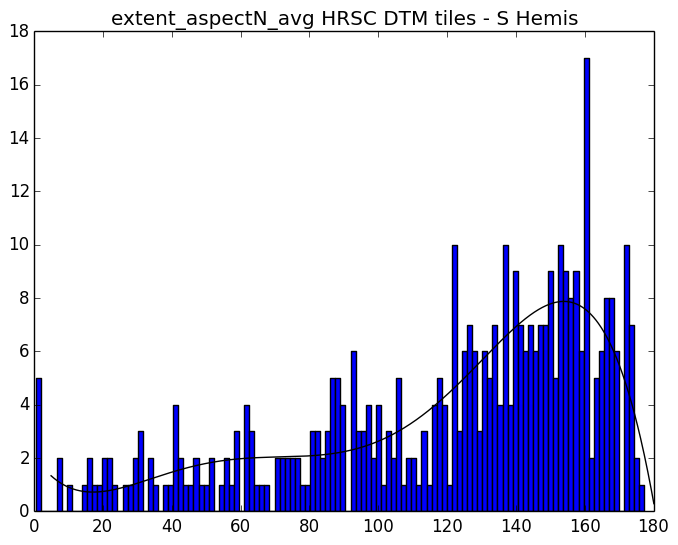
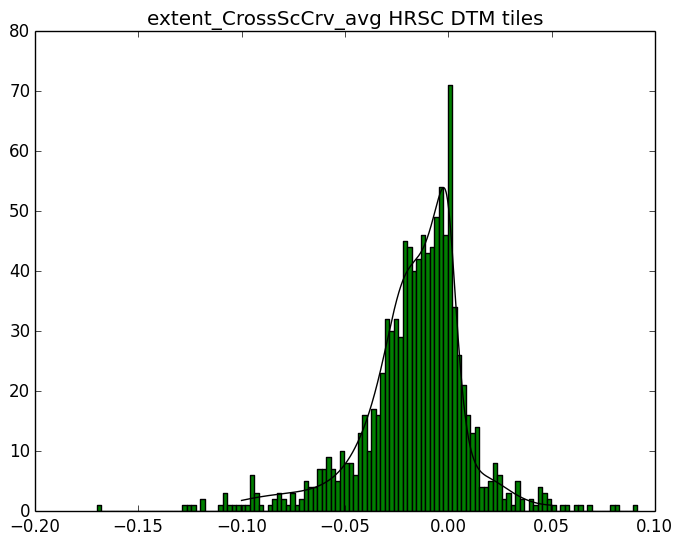
Histograms for all of the HRSC tile area:
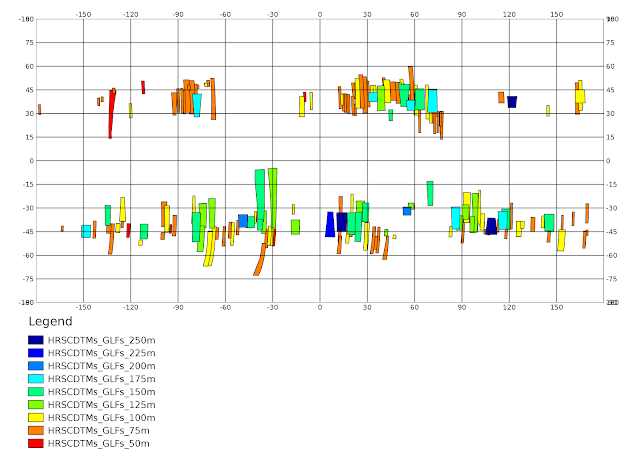 |
| This is the area of study, I only used the HRSC tiles that I had already identified as having a Souness object. It would perhaps have been better to got all the HRSC tiles between 25° and 60° in both hemispheres, for a more 'global' set of background. |
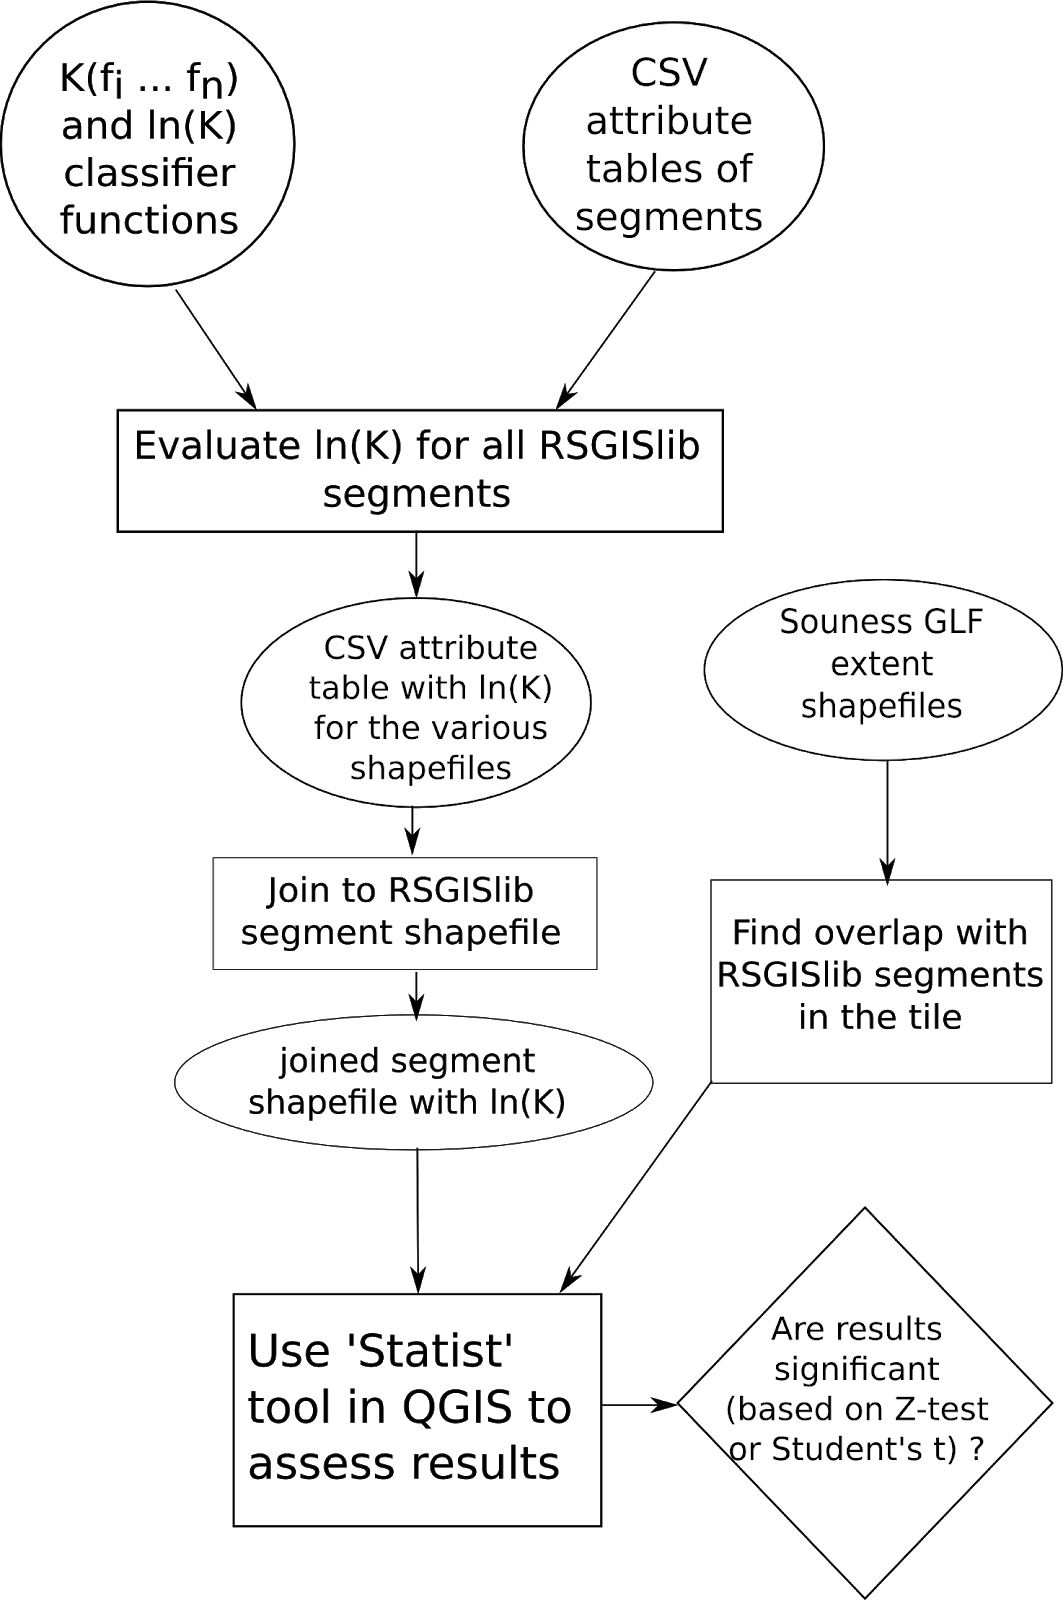
I made a 4 component gaussian fit to these, and then had analytic functions of feature variables, and then made ratios of the zonal/global as functions of the feature vector.
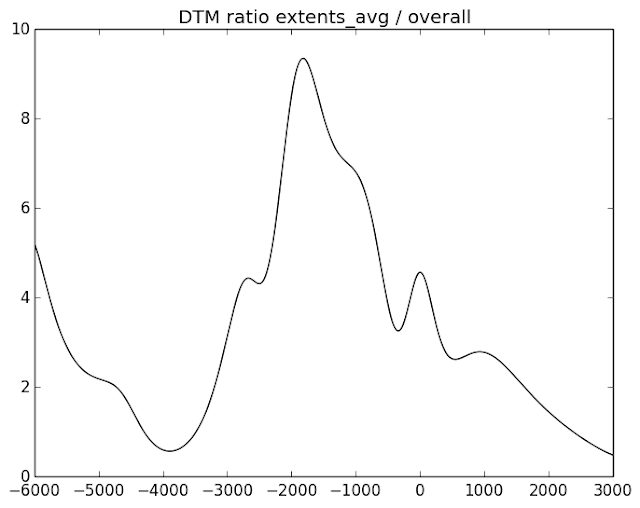 |
| The abundance of Souness GLFs when expressed as a ratio looks less bimodal than the absolute number, since the bimodality is also present in the underlying elevation distribution (though with a caveat for the 'background' excluding areas where there are no Souness objects) |
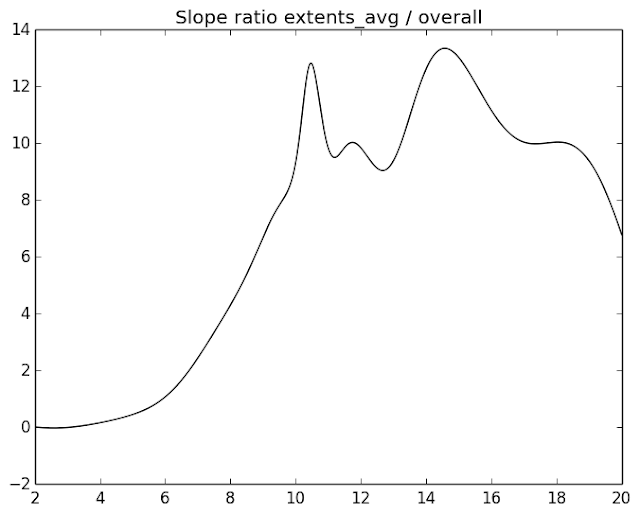 |
| Slopes of 10-20° are favoured. |
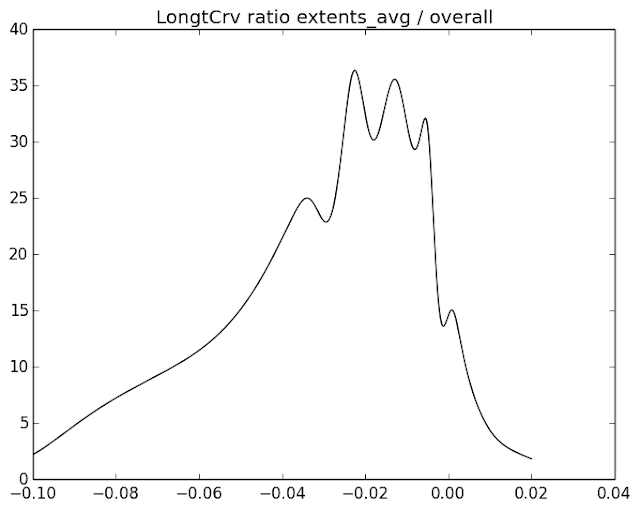 |
| Both longitudinal and cross-sectional curvature is favoured to be negative, ie. concave slopes within hollows. |
I defined the classifier function K as the product of all of these (excluding NDR since it was locally normalised in the HRSC data), and used ln(K) in my interpretation, and in the dissertation made a basic z-test showing the classifier was better than random at predicting the glaciers locations, but looking at a number of fields, it was clear the classifier was not specific to the particular type of object Souness catalogued, but perhaps could be useful as a search tool.