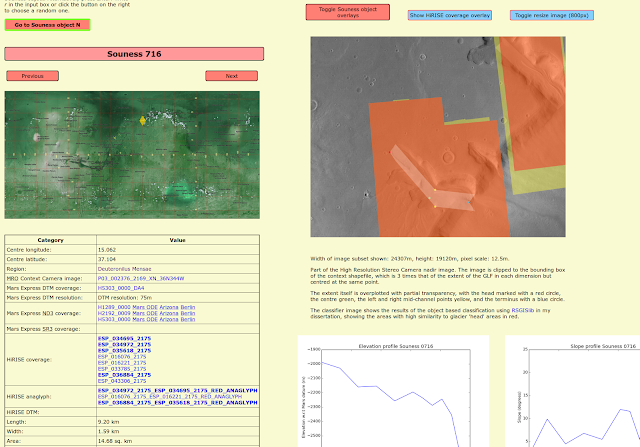
I have made some additions and improvements to my website that lists the glacier like forms on Mars
detailed by Colin Souness, and presents Mars Express data and links to HiRISE coverage from the Mars Reconnaisance Orbiter.
See an example here:
taklowkernewek.neocities.org/mars/sounesstoptrumps_js.html?S1003The data is processed using some
obsfucated Python code, which uses a combination of
RSGISlib,
GDAL via the command line and
ImageMagick to provide a subset of the HRSC data to a bounding box of the 'context' shapefile of each Souness glacier (relying on the manual identification of the 'best' HRSC footprint with DTM coverage in the dissertation work).
This presents the panchoromatic nadir image, digital terrain model, a layerstack combining HRSC image and DTM, overlaying the classifier as calculated for glacier head areas in my dissertation, or else falling back to the Mars Global Surveyor coverage in which case a lower resolution image and DTM only are available.
Overlap with HiRISE, and HiRISE anaglyphs/DTM with the extents and wider 'context9' shapefiles were automatically identified, and also the level 3 HRSC images (the ND3 links).
If you open two browser windows, you and a friend can actually play the game of Top Trumps by the first player drawing a 'card' with the choose random button, choosing a category to play, and then the second player presses their random button and see if they beat them.
It is up to you if you want to play with north good, or high elevation good etc.
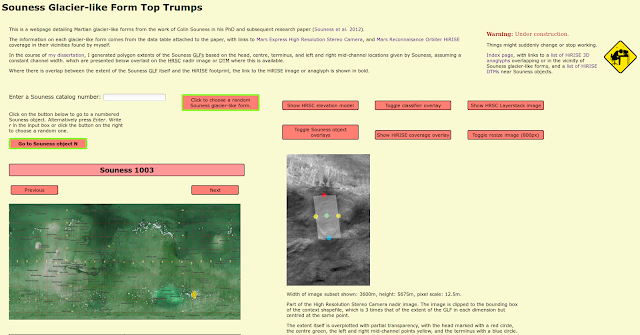 |
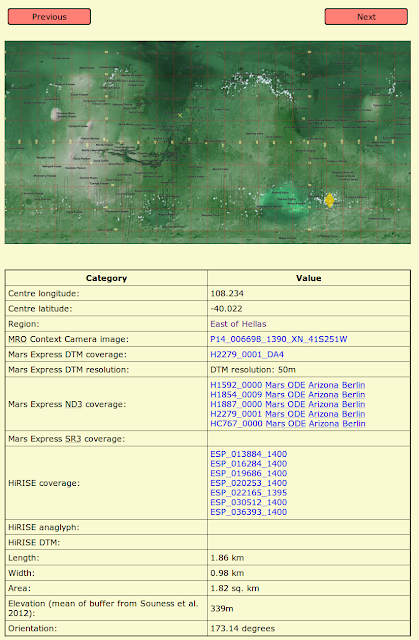
| The page showing one of the Souness glacier-like forms in the southern hemisphere on Mars. |
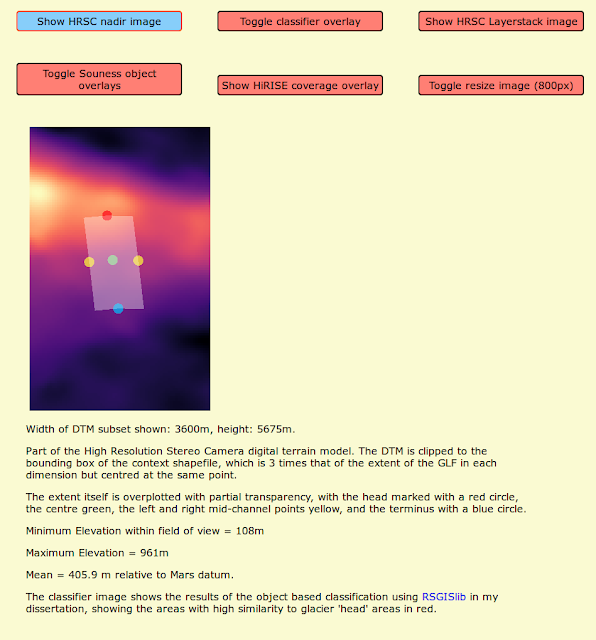 |
| Showing the High Resolution Stereo Camera aboard Mars Express digital terrain model. |
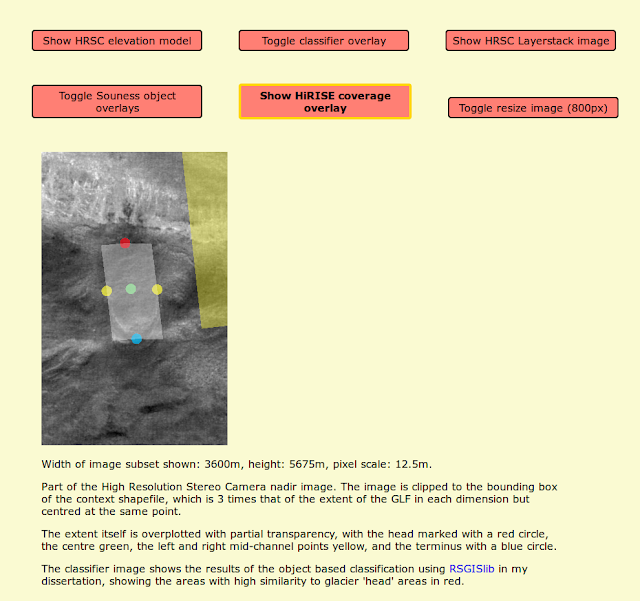 |
| Indicating HiRISE coverage with a yellow overlay, which shows that there isn't coverage over the footprint of this object, but there is in the general vicinity. See below for an example of another Souness object where there is both HiRISE and anaglyph coverage. |
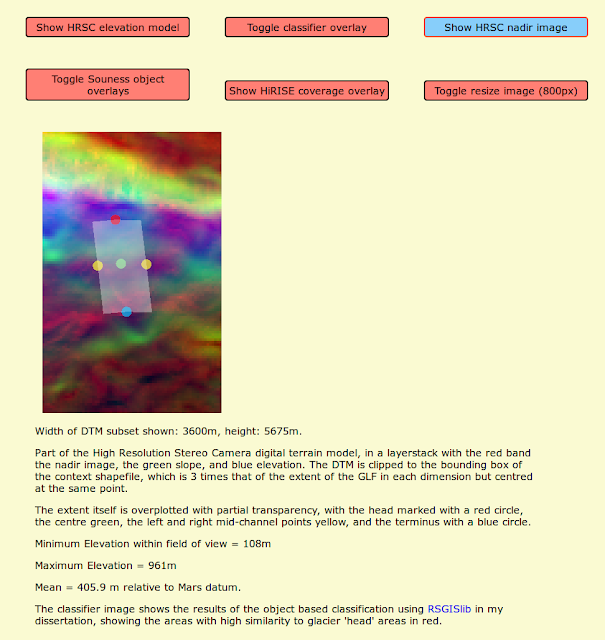 |
| A layerstack consisting of the panchromatic nadir image from HRSC (mapped to red), the slope of the DTM (green), and the elevation (blue). These are locally scaled within the bounding box of the 'context' shapefile, which is the white box visible (the extent) scaled up by a factor of three. |
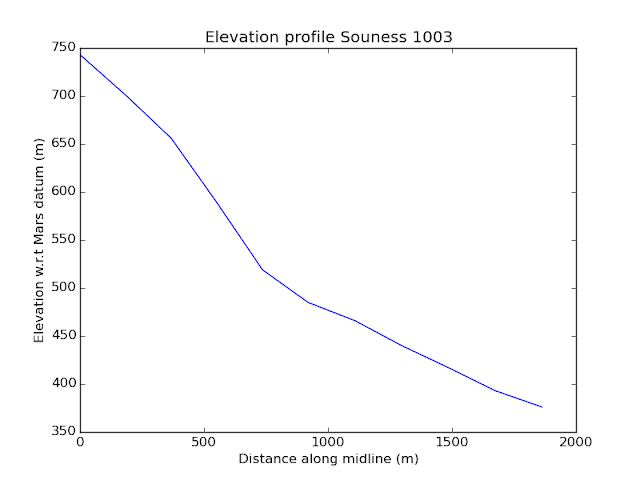 |
| Elevation profile using the h2279 HRSC terrain model. |
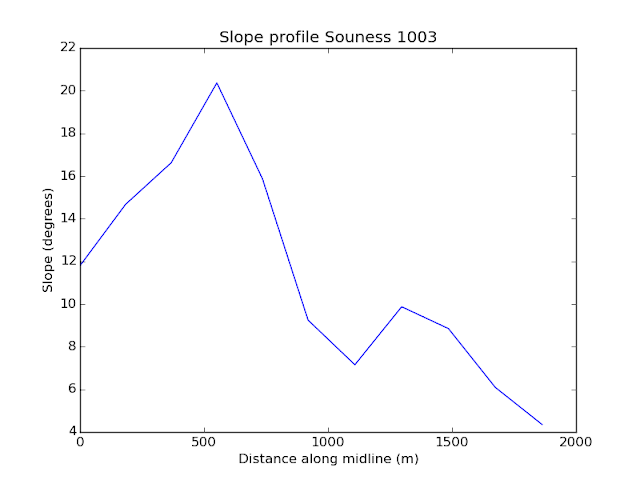 |
| Slope profile using the h2279 HRSC terrain model. |


