In my dissertation I used 179 High Resolution Stereo Camera digital terrain model tiles from the Mars Express spacecraft.
I have gone back to the code that generated the histograms below:
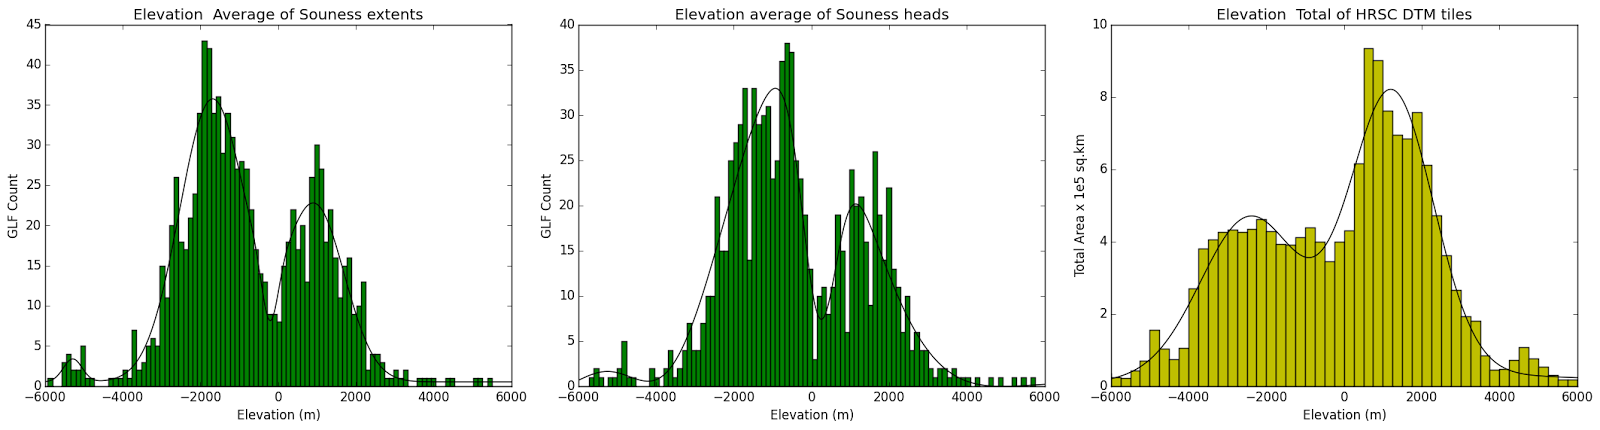
Elevation histogram consisting of the Souness glacier extent areas, glacier head areas, and the HRSC tiles as a whole, and multi-component Gaussian fits
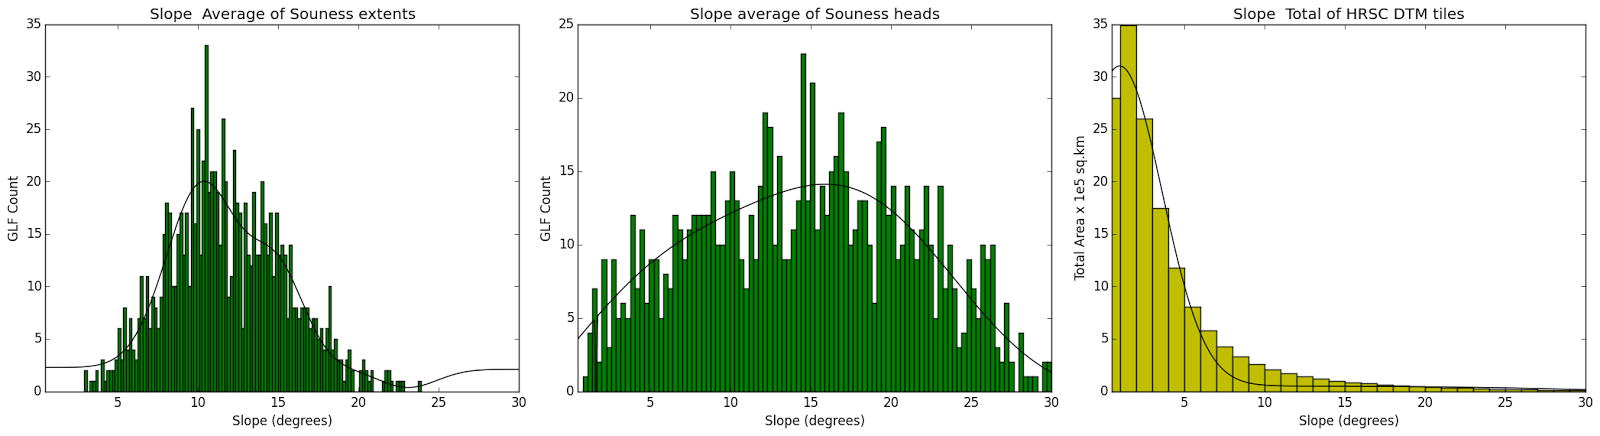
Slope histogram consisting of the Souness glacier extent areas, glacier head areas, and the HRSC tiles as a whole, and multi-component Gaussian fits
The question I thought of recently, is how does the slope vary by elevation?
I will investigate this in two ways
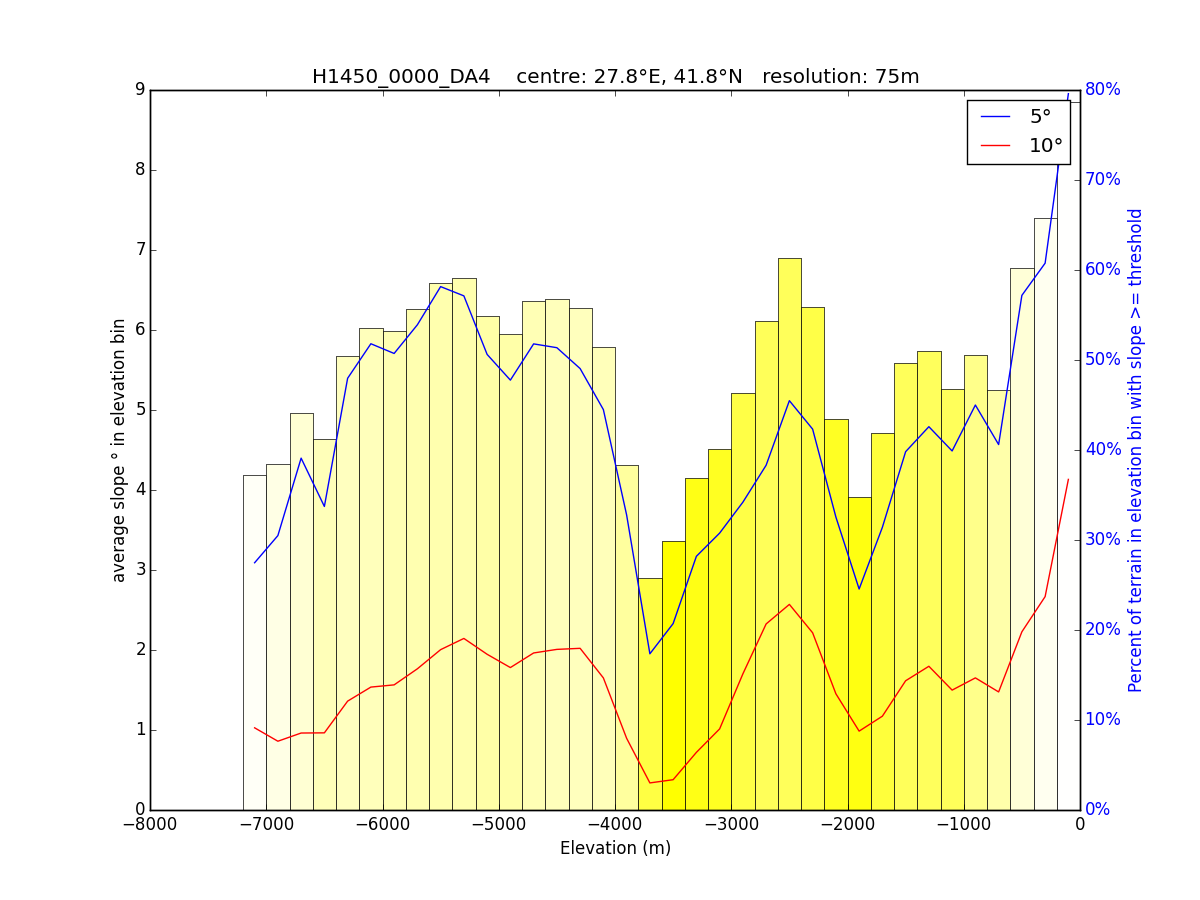
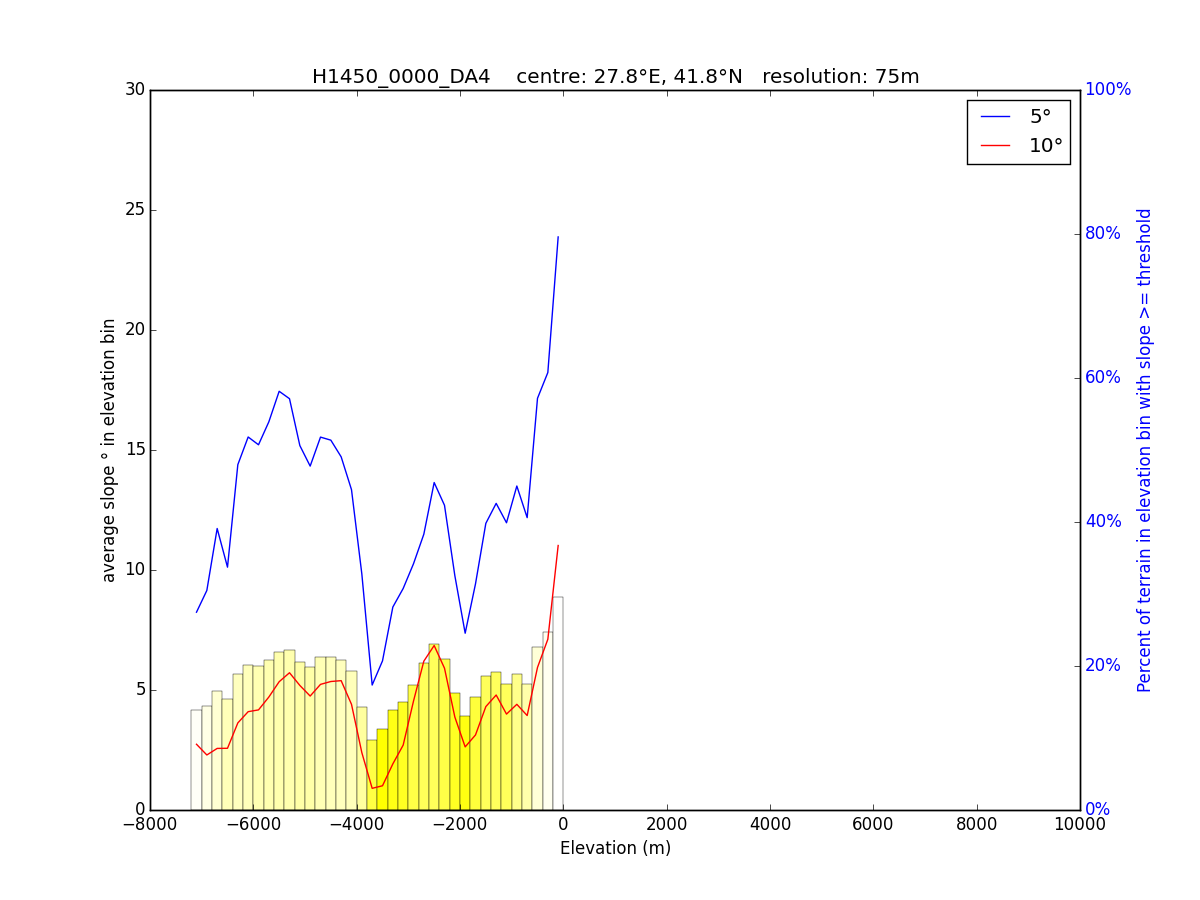
average slope
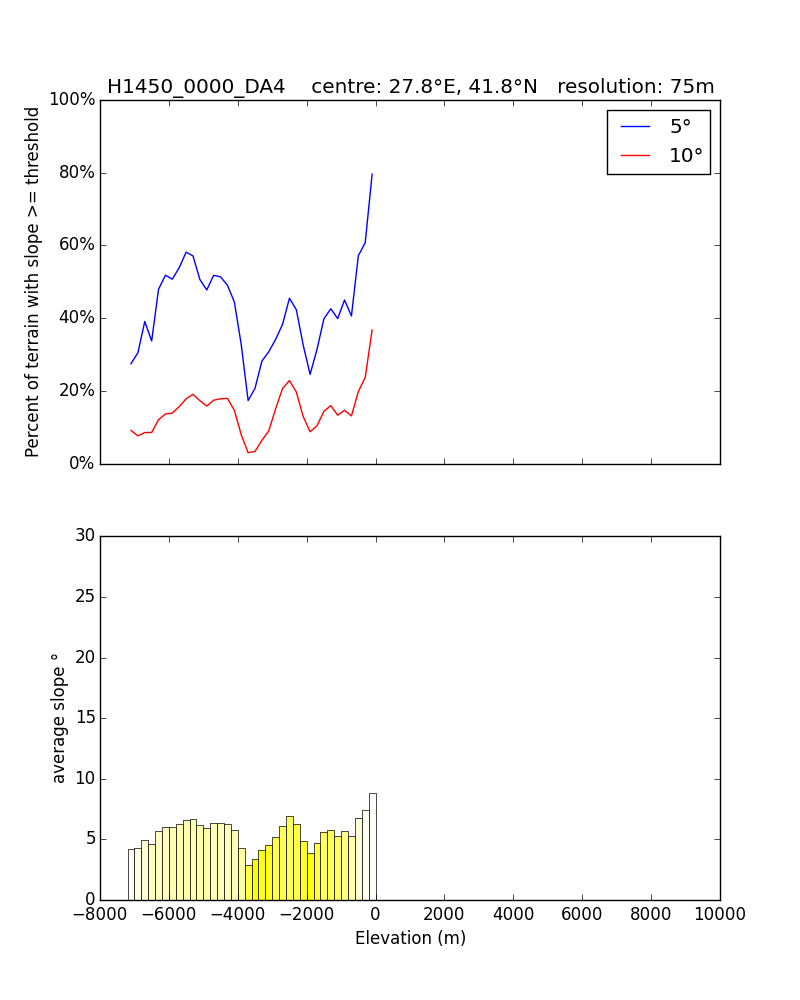
percentage of terrain exceeding a threshold in slope.
This either in a whole tile or by elevation bin.
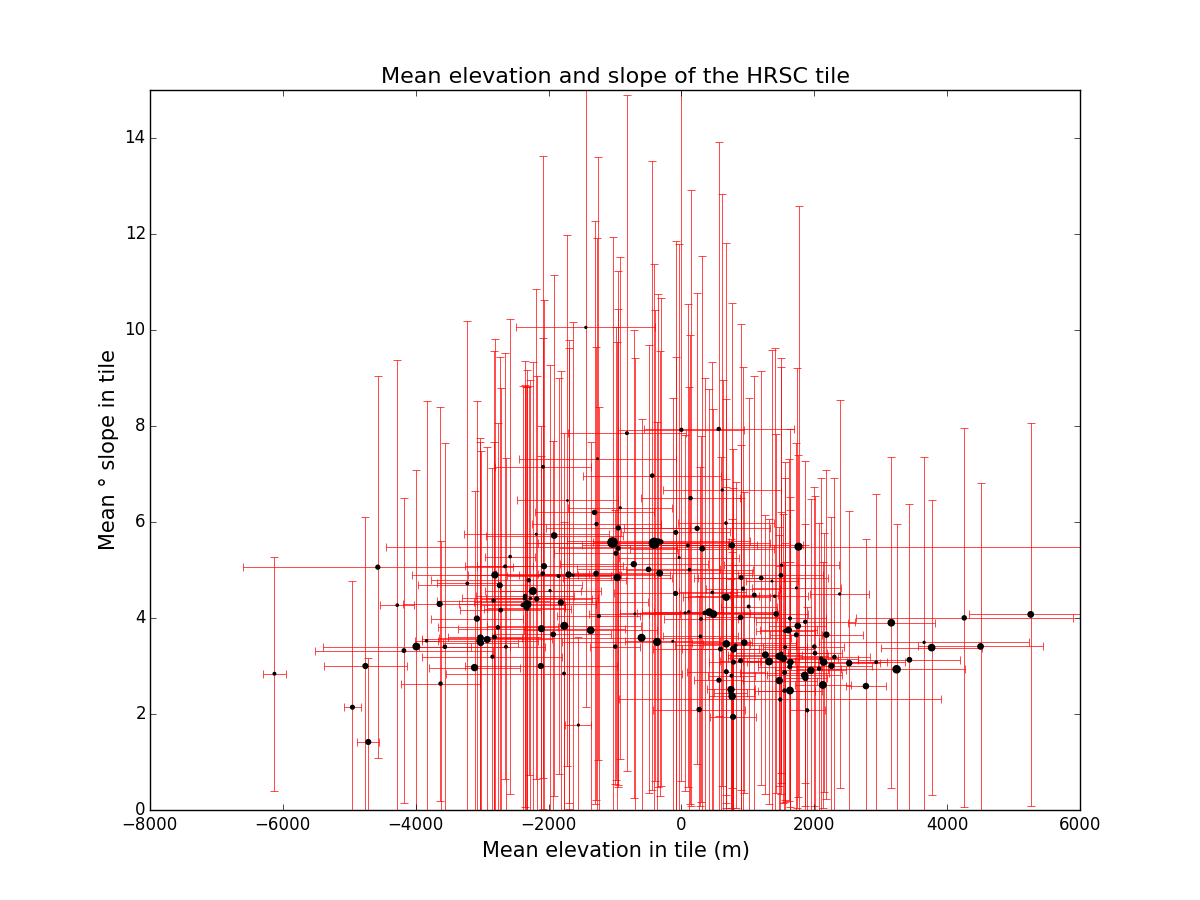
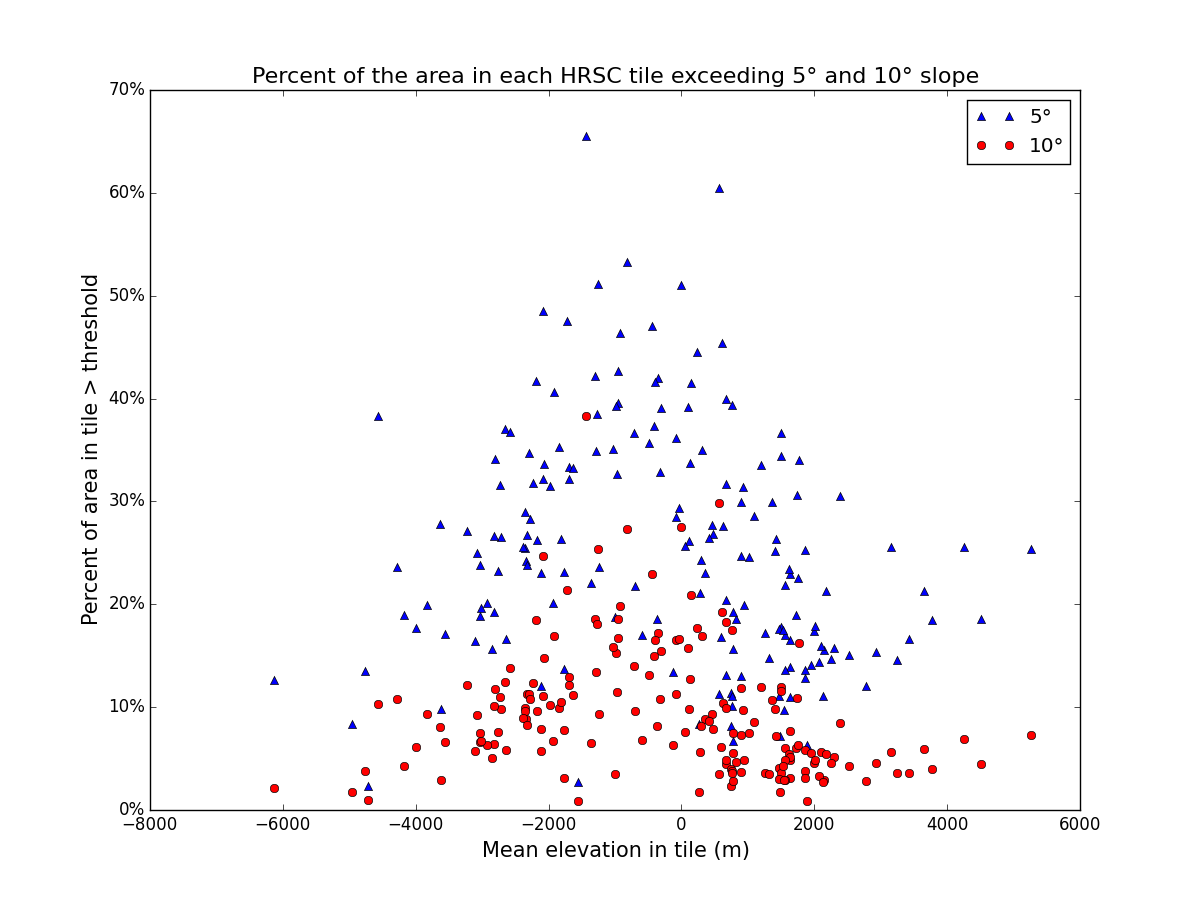
Summaries of whole tiles
Slope vs elevation, plotting the means of whole tiles. Error bars show the standard deviations of elevation and slope within each tile.
Percentage of the area in each tile exceeding slope thresholds of 5° and 10°.
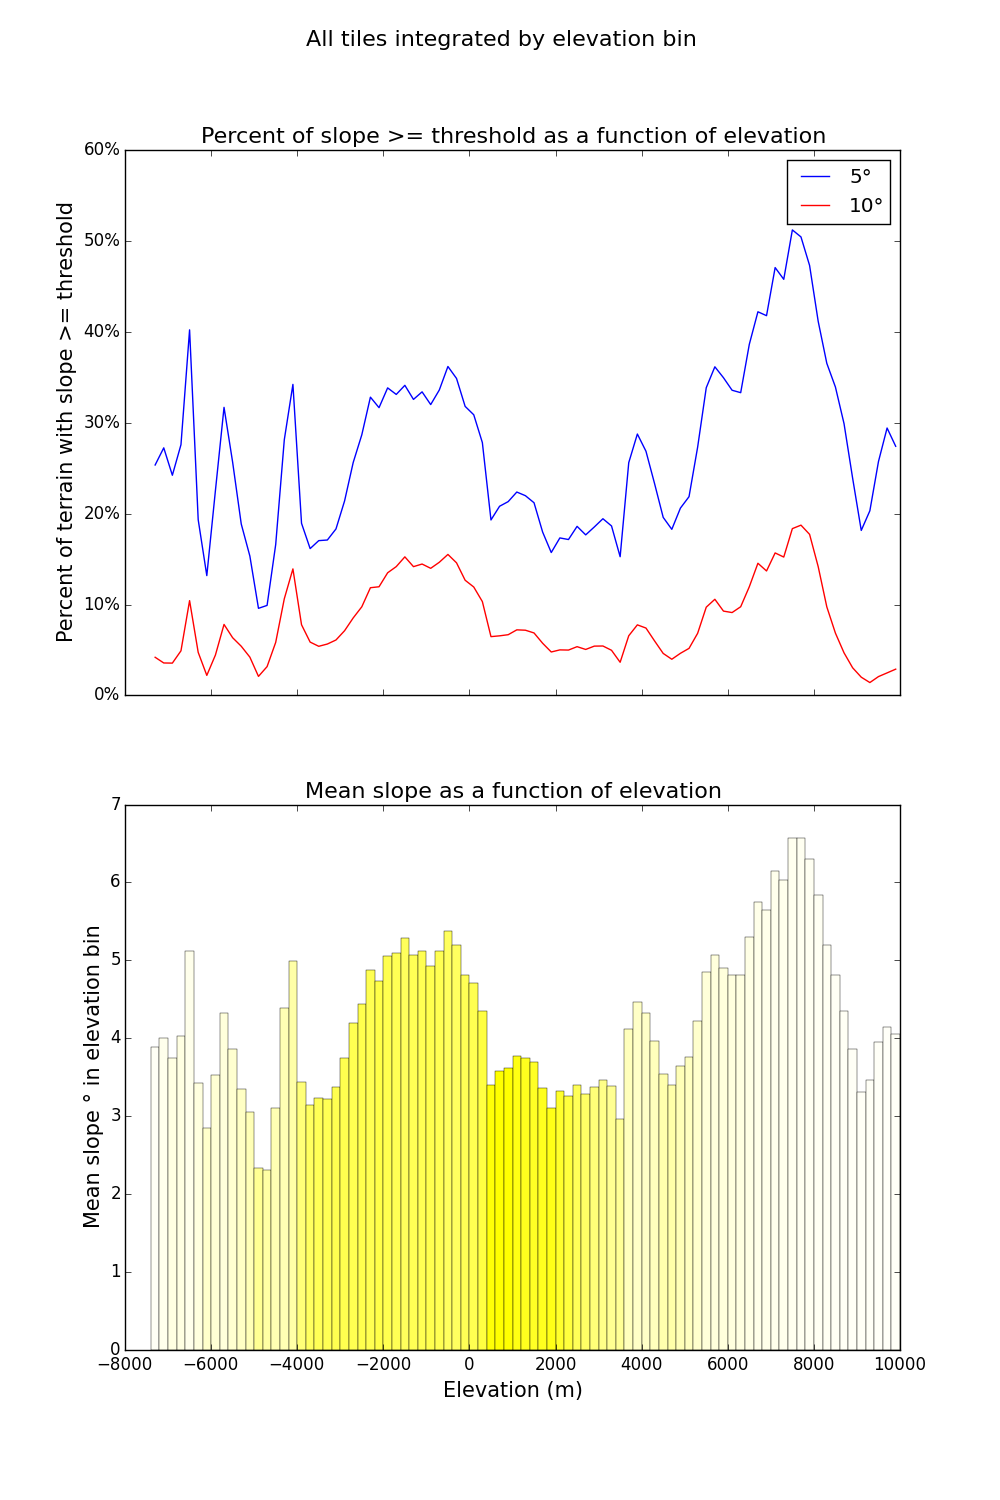
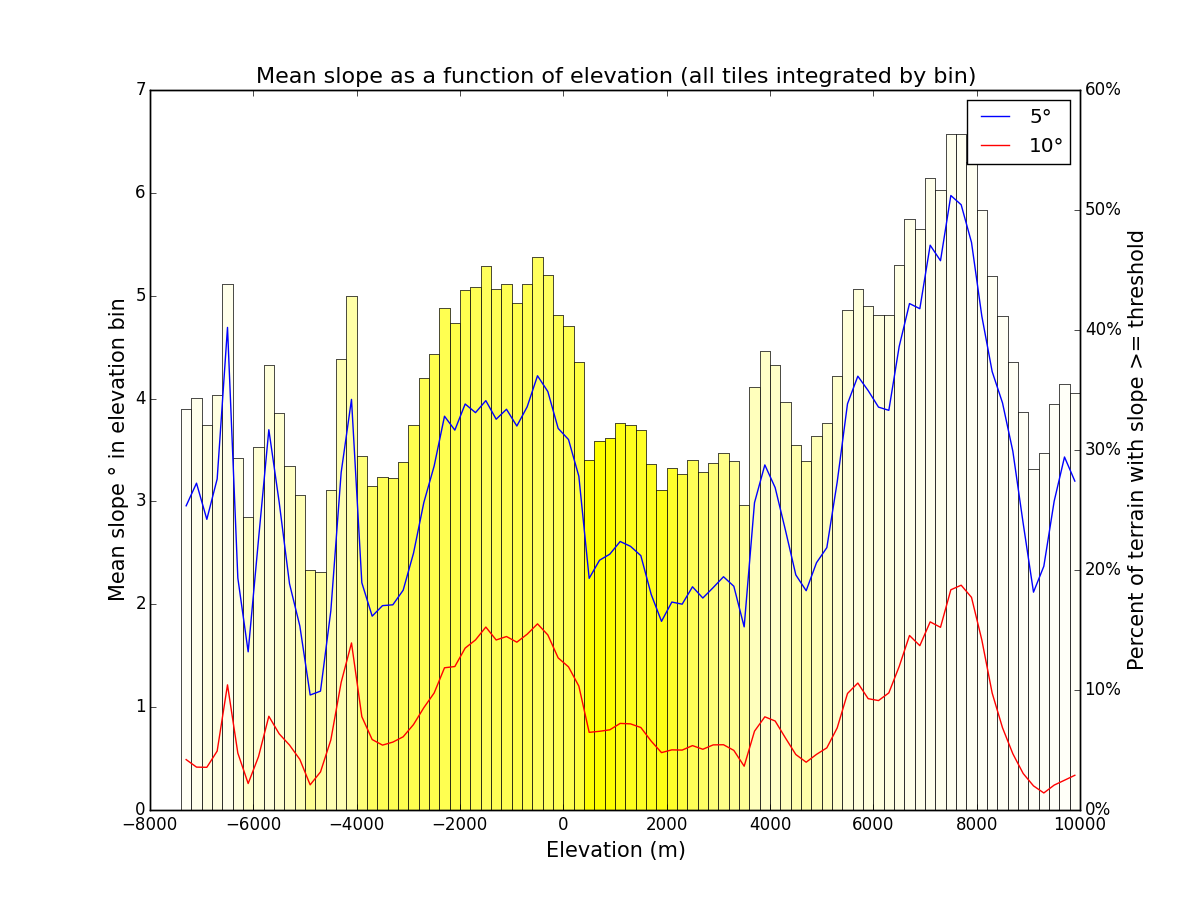
Binning by elevation
Since there is often a wide variety of elevation within a tile, and the sometimes large north-south extent of each tile, they can encompass a wide variety of terrains, I developed the program to bin the data in each tile into elevation bins, and calculate the mean slope for each bin. I currently use a bin width of 200m in elevation.
There are 179 tiles, and several different ways of plotting them, which produces a large number of plots, so I thought I'd animate them.
The frames are ordered northern hemisphere first, then the southern, and within each hemisphere by longitude from -180 to 180 degrees.
The animated versions are linked to rather than shown since they are fairly large files.
I have taken the tile h1450 as an example in showing the plots.
The tile h1450 was discussed in an earlier postand on my neocities website. The hemispheric maps there can also help in putting the tiles in their context. It contains Lyot crater, the lowest elevation anywhere in the northern hemisphere of Mars , as well as part of the elevation dichotomy boundary and a number of Souness glaciers including this one, which has a 3D HiRISE anaglyph.
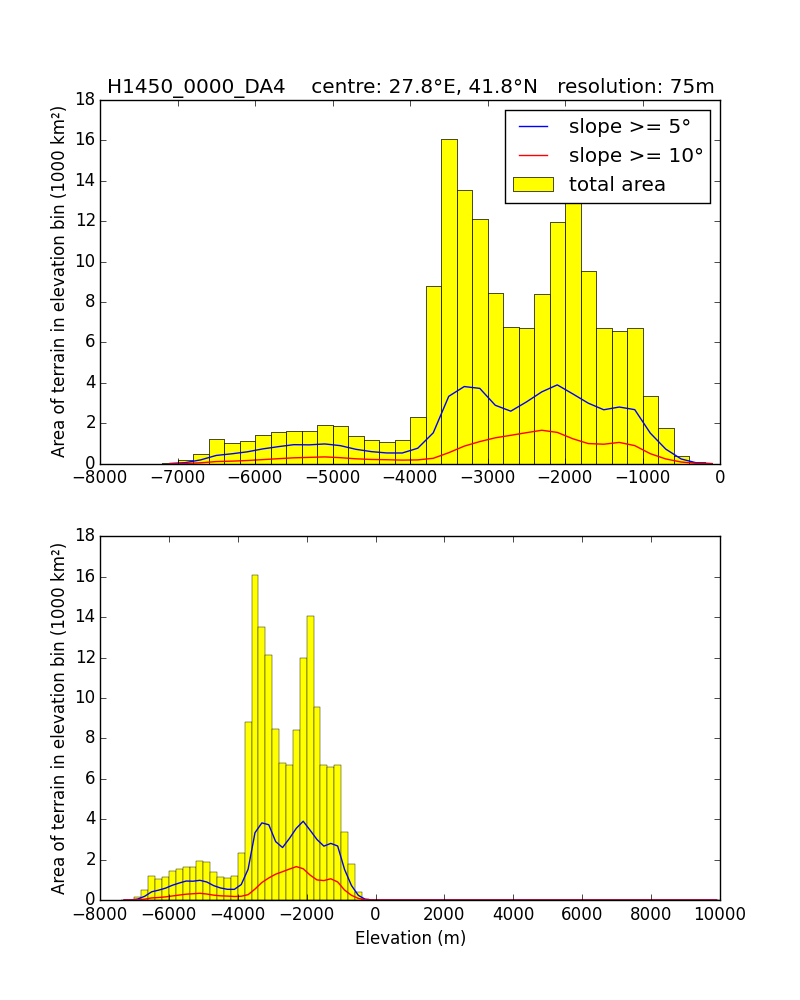
Animated elevation histograms and average slope by elevation bin
Link to animated version (6MB gif). The same data is plotted twice, firstly with an automatically scaled elevation axis, and secondly with fixed limits of -8000m, 10000m.
Link to animated version (8MB gif) Mean slope in each elevation bin in each tile, and the % of terrain with slope >= 5° and 10° in each elevation bin. The density of shading depends on the area in each elevation bin, compared with the bin having the largest amount of area.