Skrifennow
My blog, imported from Blogger and converted using Jekyll.
« Prev
1
2
3
4
5
6
7
8
9
10
11
12
13
14
15
16
17
18
19
20
21
22
23
24
25
26
27
28
29
30
31
32
33
34
35
36
37
38
39
40
41
42
43
44
45
46
47
Next »
Summary of Argyre Planitia region
Here are some overview renderings of Argyre Planitia and surrounding areas in the southern hemisphere of Mars.
I have added a lat/long graticule using the Natural Earth graticule shapefiles, setting QGIS to tell them they are in Mars 2000 lat/long.
I do not present anything like a comprehensive detailing of the glacier-like forms in this region, but here are a couple of interesting areas.
I have added a lat/long graticule using the Natural Earth graticule shapefiles, setting QGIS to tell them they are in Mars 2000 lat/long.
 |
| Argyre region, with MOC image mosaic overlaid by MOLA topography. |
 |
| The elevation colour ramp used for all of the Argyre HRSC tiles |
 |
| Background MOLA elevation ramp |
 |
| MOLA elevation alone. |
 |
| MOLA elevation blended with hillshade. |
I do not present anything like a comprehensive detailing of the glacier-like forms in this region, but here are a couple of interesting areas.
Baltisk Crater (55°W, 42°S)
 |
| HRSC nadir image in tile h0416. The HiRISE image at the left is PSP_007706_1375. |
 |
| With the classifier results. |
Nereidum Montes area (43°W, 37-38°S)
 |
| In HRSC tile h2625, two Souness GLFs on the rim of crater which also shows various channels. |
 |
| Classifier results. |
 |
| A little to the south of the previous image, several further Souness GLFs are found. This area contains a HiRISE anaglyph and DTM. The DTM coverage is outlined in yellow. |
 |
| Classifier results. |
 |
| HiRISE anaglyph ESP_013850_1415 just to the east of Souness 757. |
 |
| Colourised elevation map of HiRISE DTM. |
Summary of West Hellas region
Here is a summary map of another region of Mars from my MSc dissertation work, this time the region to the west of Hellas Planitia.

Using Google Earth to view Mars Reconnaisance orbiter CTX images of Souness 1140:

The region to the SW of Souness 1140 has HiRISE coverage including a 3D anaglyph if you have a pair of red/blue 3D glasses handy:
There are many craters in the areas west of Hellas that have a system of dunes within. This example also shows several Souness GLFs on the north wall:
 |
| Elevation (MOLA) blended with underlying MOC image mosaic. |
 |
| All tiles in this region except h2210 use this colour ramp for elevation |
 |
| MOLA elevation only. |
 |
| MOLA elevation blended with hillshade. |
Preview of a single HRSC tile h2210
This is located to the SW of Hellas Planitia, around 47°E, 48°S. The elevations within this tile range from -4542 to 1064m relative to datum. |
| Elevation blended with nadir image layer, a single Souness object is visible, but... |
 |
| The classifier predicts substantial areas, which are judged in a Bayesian sense to be similar topographically, taking account of elevation, slope, abs. aspect away from N, cross-sectional, and longitudinal curvature, to the head areas (red) and GLF extents (blue). |
 |
| The Mars Express HRSC tile's nadir image. |
 |
Using Google Earth to view Mars Reconnaisance orbiter CTX images of Souness 1140:

The region to the SW of Souness 1140 has HiRISE coverage including a 3D anaglyph if you have a pair of red/blue 3D glasses handy:
 |
| Link to University of Arizona HiRISE page for this image. |
Crater at 34°E, 47°S
There are many craters in the areas west of Hellas that have a system of dunes within. This example also shows several Souness GLFs on the north wall:
 |
| Seven Souness GLFs are found here, within HRSC tile h2441. There is a HiRISE anaglyph of the dune system. |
 |
| HSRC nadir image. |
 |
| Bayesian classifier results. |
 |
| This is a colourised representatio of the topography that may be difficult to interpret, but I thought I would present it to show a little of what is being done with the derived topographic variables. In this case, I have made a RGB false colour rendering, with red mapped to slope, green mapped to cross-sectional curvature, and blue mapped to longitudinal curvature. |
Preview of the SE highlands of Mars
As I wrote in the last post, I am in the process of dividing up my QGIS projects covering the Mars Express HRSC DTM tiles that cover areas where Colin Souness found 'glacier-like forms' in his PhD and research paper.
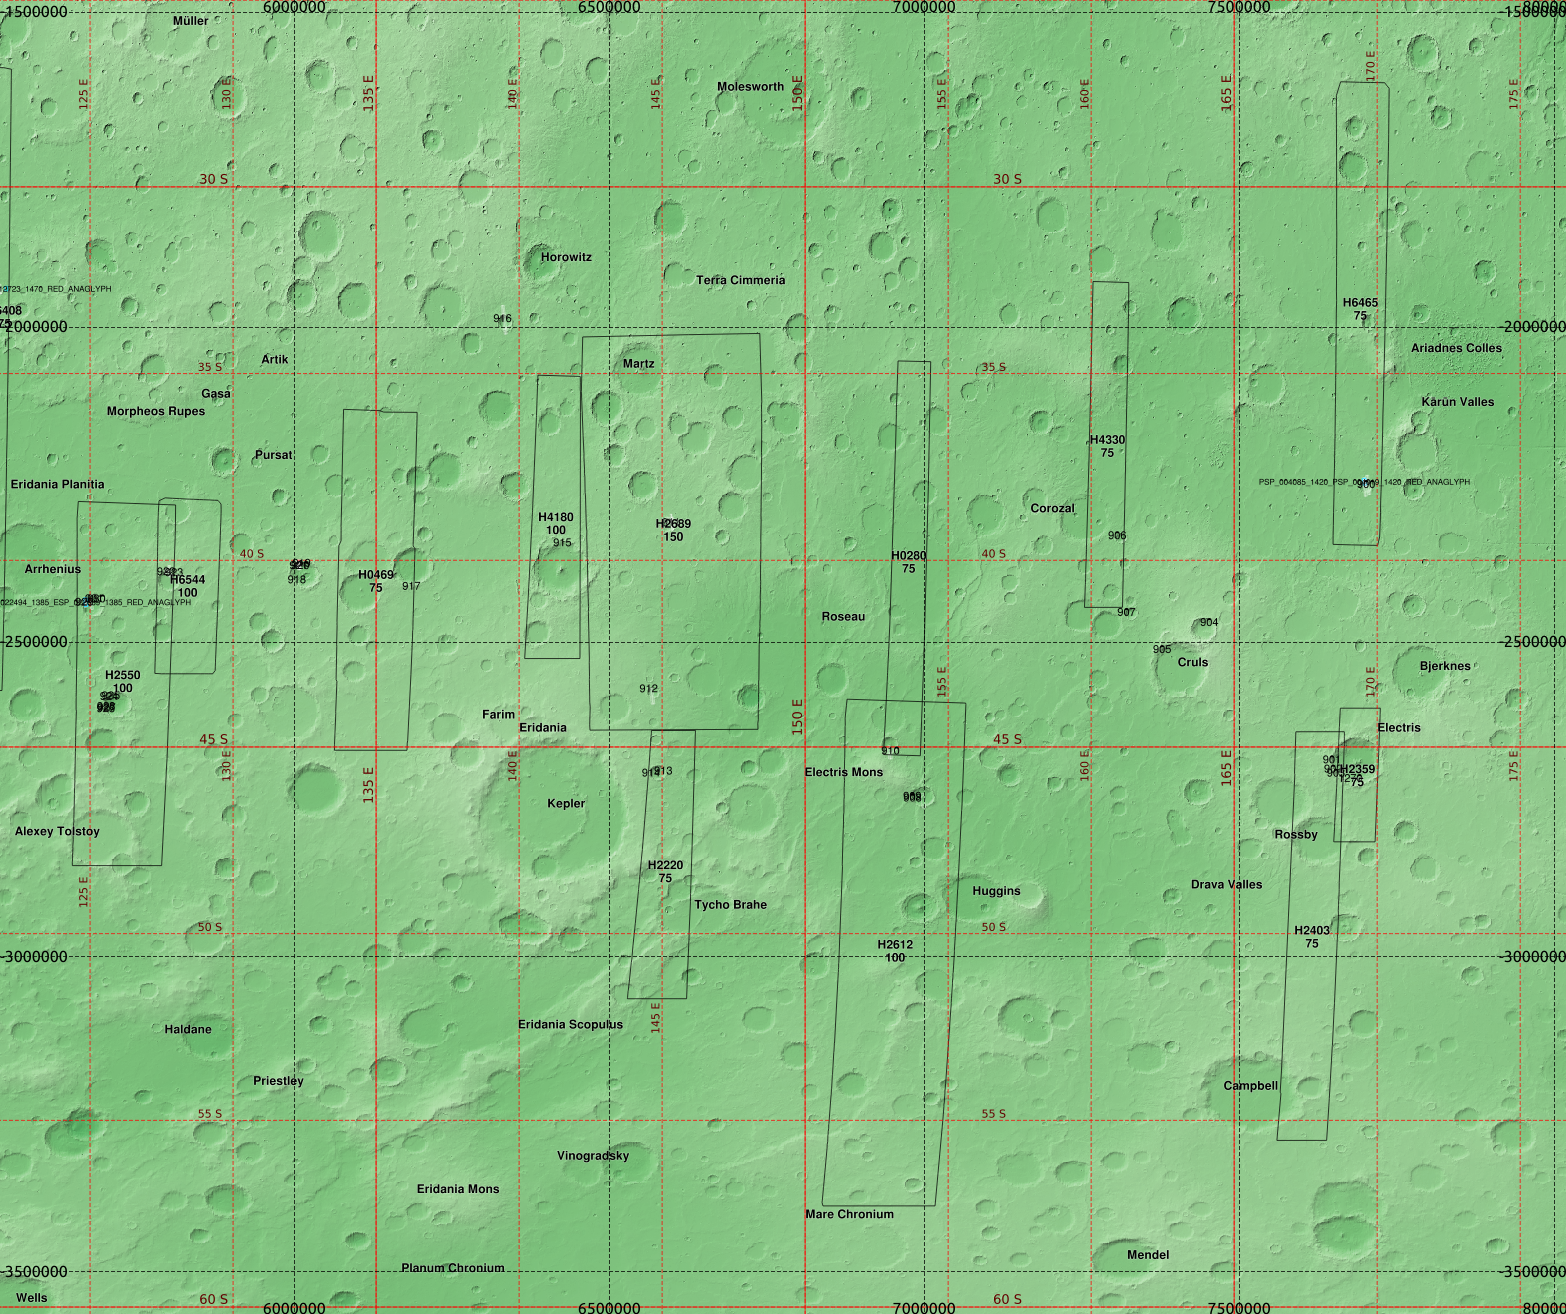
I now come to the southeastern highlands:
There are relatively few Souness GLFs in this region,found in crater walls. There are a number of these that look quite interesting - where within the same crater part of it looks glacial, and other parts have terrain produced by erosion by liquid.
I now come to the southeastern highlands:
 |
| Again, I use the equicylindrical projection optimised for 40° latitude, units are metres. |
 |
| The elevation colour ramp for the underlying backdrop of the MOLA/MGS topography. In the above rendering this is blended with the Mars Orbiter Camera image mosaic. |
 |
| In this region, I am able to use a single colour ramp for all of the various HRSC DTM tiles. |
 |
| The MOLA elevation alone. |
 |
| The MOLA elevation, blended with hillshade. |
There are relatively few Souness GLFs in this region,found in crater walls. There are a number of these that look quite interesting - where within the same crater part of it looks glacial, and other parts have terrain produced by erosion by liquid.
Crater at 125°E, 41°S
 |
| Several Souness GLFs, including one covered by an anaglyph ESP_022494_1385. |
 |
| The classifier results (blue for topographic similarity to 'extent' areas, and red for topohgraphic similarity to 'head' area) overplotted on the HRSC nadir image. |
Crater at 126°E, 44°S
 |
| Several Souness GLFs and other areas showing flow features. Souness 928 appears to have its 'head' and 'terminus' locations interchanged in the catalog. |
 |
| Classifier results. |
Crater at 141°E, 40°S
 |
| Souness 915 appears in the northern wall of the crater, and fluvial-like channels in the south wall. |
 |
| A closer look at the north wall. |
 |
| The classifier results. |
 |
| The channels visible in the southern wall. |
 |
| Classifier results. |
Crater at 169°E, 45°S
 |
| Four Souness GLFs are found in this crater. |
 |
| With the classifier results. |
Summary of area east of Hellas Planitia
In a previous set of posts, I showed a summary map of the mid-latitudes of each hemisphere of Mars, showing the Mars Express HRSC tiles and the Souness glacier-like forms.
The QGIS project file for the southern hemisphere using only tiles with DTMs at resolutions 50m and 75m currently takes over 15 minutes to load, on a quad-core i5 PC with 32GB RAM.
To make it more managable I cut it down to the region of Mars east of Hellas Planitia region of Mars. This allows me to add it a few more fields with lower resolution HRSC DTMs.
The overview looks like this:
Below I show a pure colour ramp for the elevation only, as well as the colour ramp overlaid with a hillshade (blended with 'Hard Light' in QGIS):
The QGIS project file for the southern hemisphere using only tiles with DTMs at resolutions 50m and 75m currently takes over 15 minutes to load, on a quad-core i5 PC with 32GB RAM.
To make it more managable I cut it down to the region of Mars east of Hellas Planitia region of Mars. This allows me to add it a few more fields with lower resolution HRSC DTMs.
The overview looks like this:
 |
| Hellas Planitia is on the left (the terrain is intrinsically bright). Units are in metres in the equicylindrical projection at standard latitude of 40° (approx 2371000m). 1 degree of latitude is approx 60km. 1 degree of longitude is approx 45km at 40° latitude. |
 |
| HRSC DTM elevation colour ramp for the majority of fields (except a few within Hellas which start at -8000m) |
 |
| A crater at ~ 97°E, 37.5°S, in the HRSC tile h6437. A large number of Souness GLFs are seen in a relatively small area around an eroded crater in Hellas Montes. There are several HiRISE anaglyphs: ESP_020860_1420, PSP_006672_1420, PSP_005670_1415. |
 |
| Nadir image alone. |
 |
| The same region, showing the areas of high values of the classifier fuction for extent areas (blue) and head areas (red), overlaid of the nadir image for tile h6437. |
 |
| Screenshot from Google Earth showing CTX imagery of the same area. |
Elevation and hillshade
One of the problems with the visualisation as it is, is that the green channel is overloaded, because of the way the greyscale nadir image is blended with overlaid topography encoded with a colour ramp.Below I show a pure colour ramp for the elevation only, as well as the colour ramp overlaid with a hillshade (blended with 'Hard Light' in QGIS):
 | |
| The colour ramp used for elevation (m relative to datum) |
 |
| Elevation only (MOLA/Mars Global Surveyor) |
 |
| Elevation with a hillshade layer blended. |
Near Reull Vallis
 |
| An area around 109°E, 42°S that is particularly rich in Souness GLFs. There are several anaglyphs of this region: ESP_020530_1370, PSP_004285_1375, PSP_005696_1380, ESP_013528_1380, ESP_016706_1380. |
 |
| Nadir image |
 |
| Classifier function overplotted |
 |
| One of the stereo pair of images for the anaglyph PSP_004285_1375_ESP_012328_1375 captured a dust devil. See also www.uahirise.org/PSP_004285_1375. |
Greg Crater
 |
| The northern portion of Crater Greg, in which there are a number of Souness GLFs inside the rim. There are several HiRISE anaglyphs here: PSP_001964_1415, ESP_020121_1410, PSP_003243_1415. |
 |
| HRSC nadir image |
 |
| With the classifier. |
 |
| The southern portion of Greg, showing gullies in the southern rim. |
 |
| With the classifier. |
A possible bug in QGIS 2.12
Working with my maps of a segmented DEM showing average slope direction and magnitude, and curvature with arrows, I noticed it broke once I upgraded to QGIS 2.12.
Unless there has been some change in the syntax of expressions that I didn't get from the QGIS 2.12 changelog I suspect a bug.
I made a minimal example, which I shared via GIS Stack Exchange and QGIS issue tracker.
Unless there has been some change in the syntax of expressions that I didn't get from the QGIS 2.12 changelog I suspect a bug.
I made a minimal example, which I shared via GIS Stack Exchange and QGIS issue tracker.
 |
| QGIS 2.10.1. The width of the lines are proportional to the magnitude of the slope, and the colours are proportional to the 'longitudinal curvature' with blue for concave slopes and red for convex. No prizes for guessing the location since it's labelled on the maps at the links above. |
 |
| QGIS 2.12. Styling is lost for the slope magnitude and longitudinal curvature, but slope direction is still shown. |
« Prev
1
2
3
4
5
6
7
8
9
10
11
12
13
14
15
16
17
18
19
20
21
22
23
24
25
26
27
28
29
30
31
32
33
34
35
36
37
38
39
40
41
42
43
44
45
46
47
Next »