Skrifennow
My blog, imported from Blogger and converted using Jekyll.
« Prev
1
2
3
4
5
6
7
8
9
10
11
12
13
14
15
16
17
18
19
20
21
22
23
24
25
26
27
28
29
30
31
32
33
34
35
36
37
38
39
40
41
42
43
44
45
46
47
Next »
A map of Aberystwyth using lines along slope direction to indicate slope
This is another map like the ones in yesterday's post, this time of the town of Aberystwyth in Wales, and a little of the area surrounding it.
I have altered the spacing of the slope lines, which are now 20m apart, with grid squares shown at 1km size.
Roads as usual come from OpenStreetMap, with OS Vector Map foreshore, woodland, plus tidal and inland water (the labels of these are from OpenStreetMap - possibly a dangerous thing to do, if something is in OSM but not OS VectorMap there will be a labelled object that is not mapped!).
Hill peaks are from www.hill-bagging.co.uk, plotting all greater than 150m with more than 20m drop.
As before, the steepness of hills is indicated by the width of the slope lines, in this version, they are plotted with 10*((Slope_deg_Mean - 2.25) / 45.0) metres width, if the slope exceeds 2.25 degrees, and if not omitted.
That is no lines are plotted where the average slope of the segment is less than 1 in 20, and increase in width up to 19.5m as slope approaches 90 degrees. So a vertical cliff will be almost solid red.
They are plotted in the direction of the mean aspect of the segment. This is the real aspect, not the absolute distance from north.
It is possible that a segment facing north may for example have half of it at 1 degree east, and the other half at 359 degrees. Thus the average would be at 180 degrees. This doesn't matter because the lines have no arrows on them.
However if you have 3/4 of it facing 359 degrees, and 1/4 facing 1 degree, then it would produce spurious results, therefore slope direction may be dubious on north-facing slopes.
When I originally did this, I thought that the excess division of segments along the N/S line when I segmented using the original aspect, rather than the absolute angle from north, was a problem. However for this purpose, dividing segments that cross the 360/0 degree discontinuity helps some of the north-facing slopes avoid spurious east-west 'mean aspect' of segments:
I have altered the spacing of the slope lines, which are now 20m apart, with grid squares shown at 1km size.
Roads as usual come from OpenStreetMap, with OS Vector Map foreshore, woodland, plus tidal and inland water (the labels of these are from OpenStreetMap - possibly a dangerous thing to do, if something is in OSM but not OS VectorMap there will be a labelled object that is not mapped!).
Hill peaks are from www.hill-bagging.co.uk, plotting all greater than 150m with more than 20m drop.
As before, the steepness of hills is indicated by the width of the slope lines, in this version, they are plotted with 10*((Slope_deg_Mean - 2.25) / 45.0) metres width, if the slope exceeds 2.25 degrees, and if not omitted.
That is no lines are plotted where the average slope of the segment is less than 1 in 20, and increase in width up to 19.5m as slope approaches 90 degrees. So a vertical cliff will be almost solid red.
They are plotted in the direction of the mean aspect of the segment. This is the real aspect, not the absolute distance from north.
It is possible that a segment facing north may for example have half of it at 1 degree east, and the other half at 359 degrees. Thus the average would be at 180 degrees. This doesn't matter because the lines have no arrows on them.
However if you have 3/4 of it facing 359 degrees, and 1/4 facing 1 degree, then it would produce spurious results, therefore slope direction may be dubious on north-facing slopes.
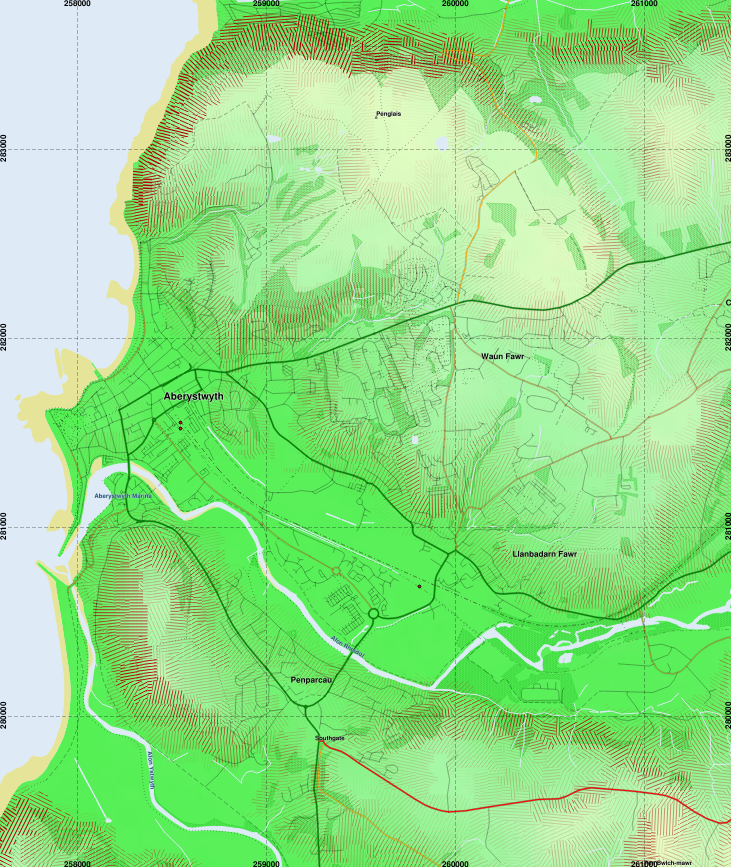 |
| Aberystwyth, with the Ystwyth and Rheidol rivers, and Clarach Bay at the top. There are certain areas where a north-facing slope is given a spurious east-west slope line, such as the north-facing slope at the top of this image at Clarach. |
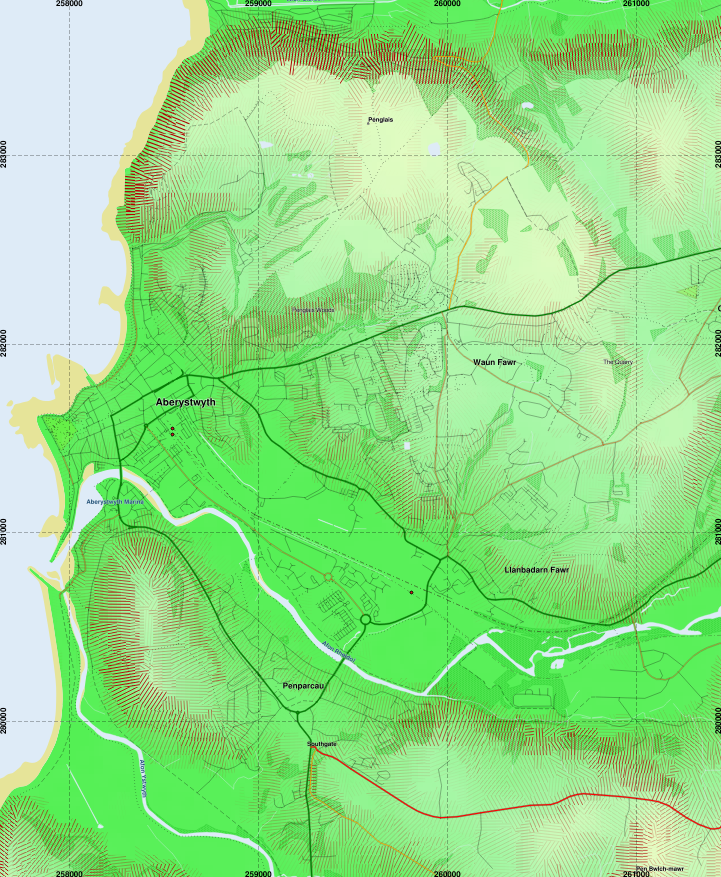 |
| Compare the north-facing slopes to the previous image. |
 |
| The segment boundaries plotted for illustrative purposes. |
Segmenting a DEM with RSGISLib and shading slope with lines
Here I demonstrate a scheme of visualising slopes on a map using lines to indicate direction and steepness of slope.
This is not necessarily easy, because both vary continuously across a terrain.
So therefore I thought to use RSGISLib to segment a digital elevation model, that I had derived from SRTM 1 arcsec data, and used GDAL and LandSerf to create derived topographic variables and make a layerstack that consisted of 6 bands:
I told RSGISLib to use all bands except band 3 - to avoid the 360/0 discontinuity dominating the segmentation and getting a large number of segments divided along the N/S axis.
After producing the segmented DEM, then it is a matter of using RSGISLib to populate the Mean and StdDev of each band to the raster attribute table of the segment clumps file, and creating a shapefile version using gdal_polygonize and using RSGISLib to export the raster attribute table into a CSV file. There is a fair bit of scripting involved, but I was able to recycle the scripts from my MSc dissertation.
Then I load this up into QGIS, and create some styling rules to show the lines in the direction of the aspect, and thickness according to the steepness of the slope.
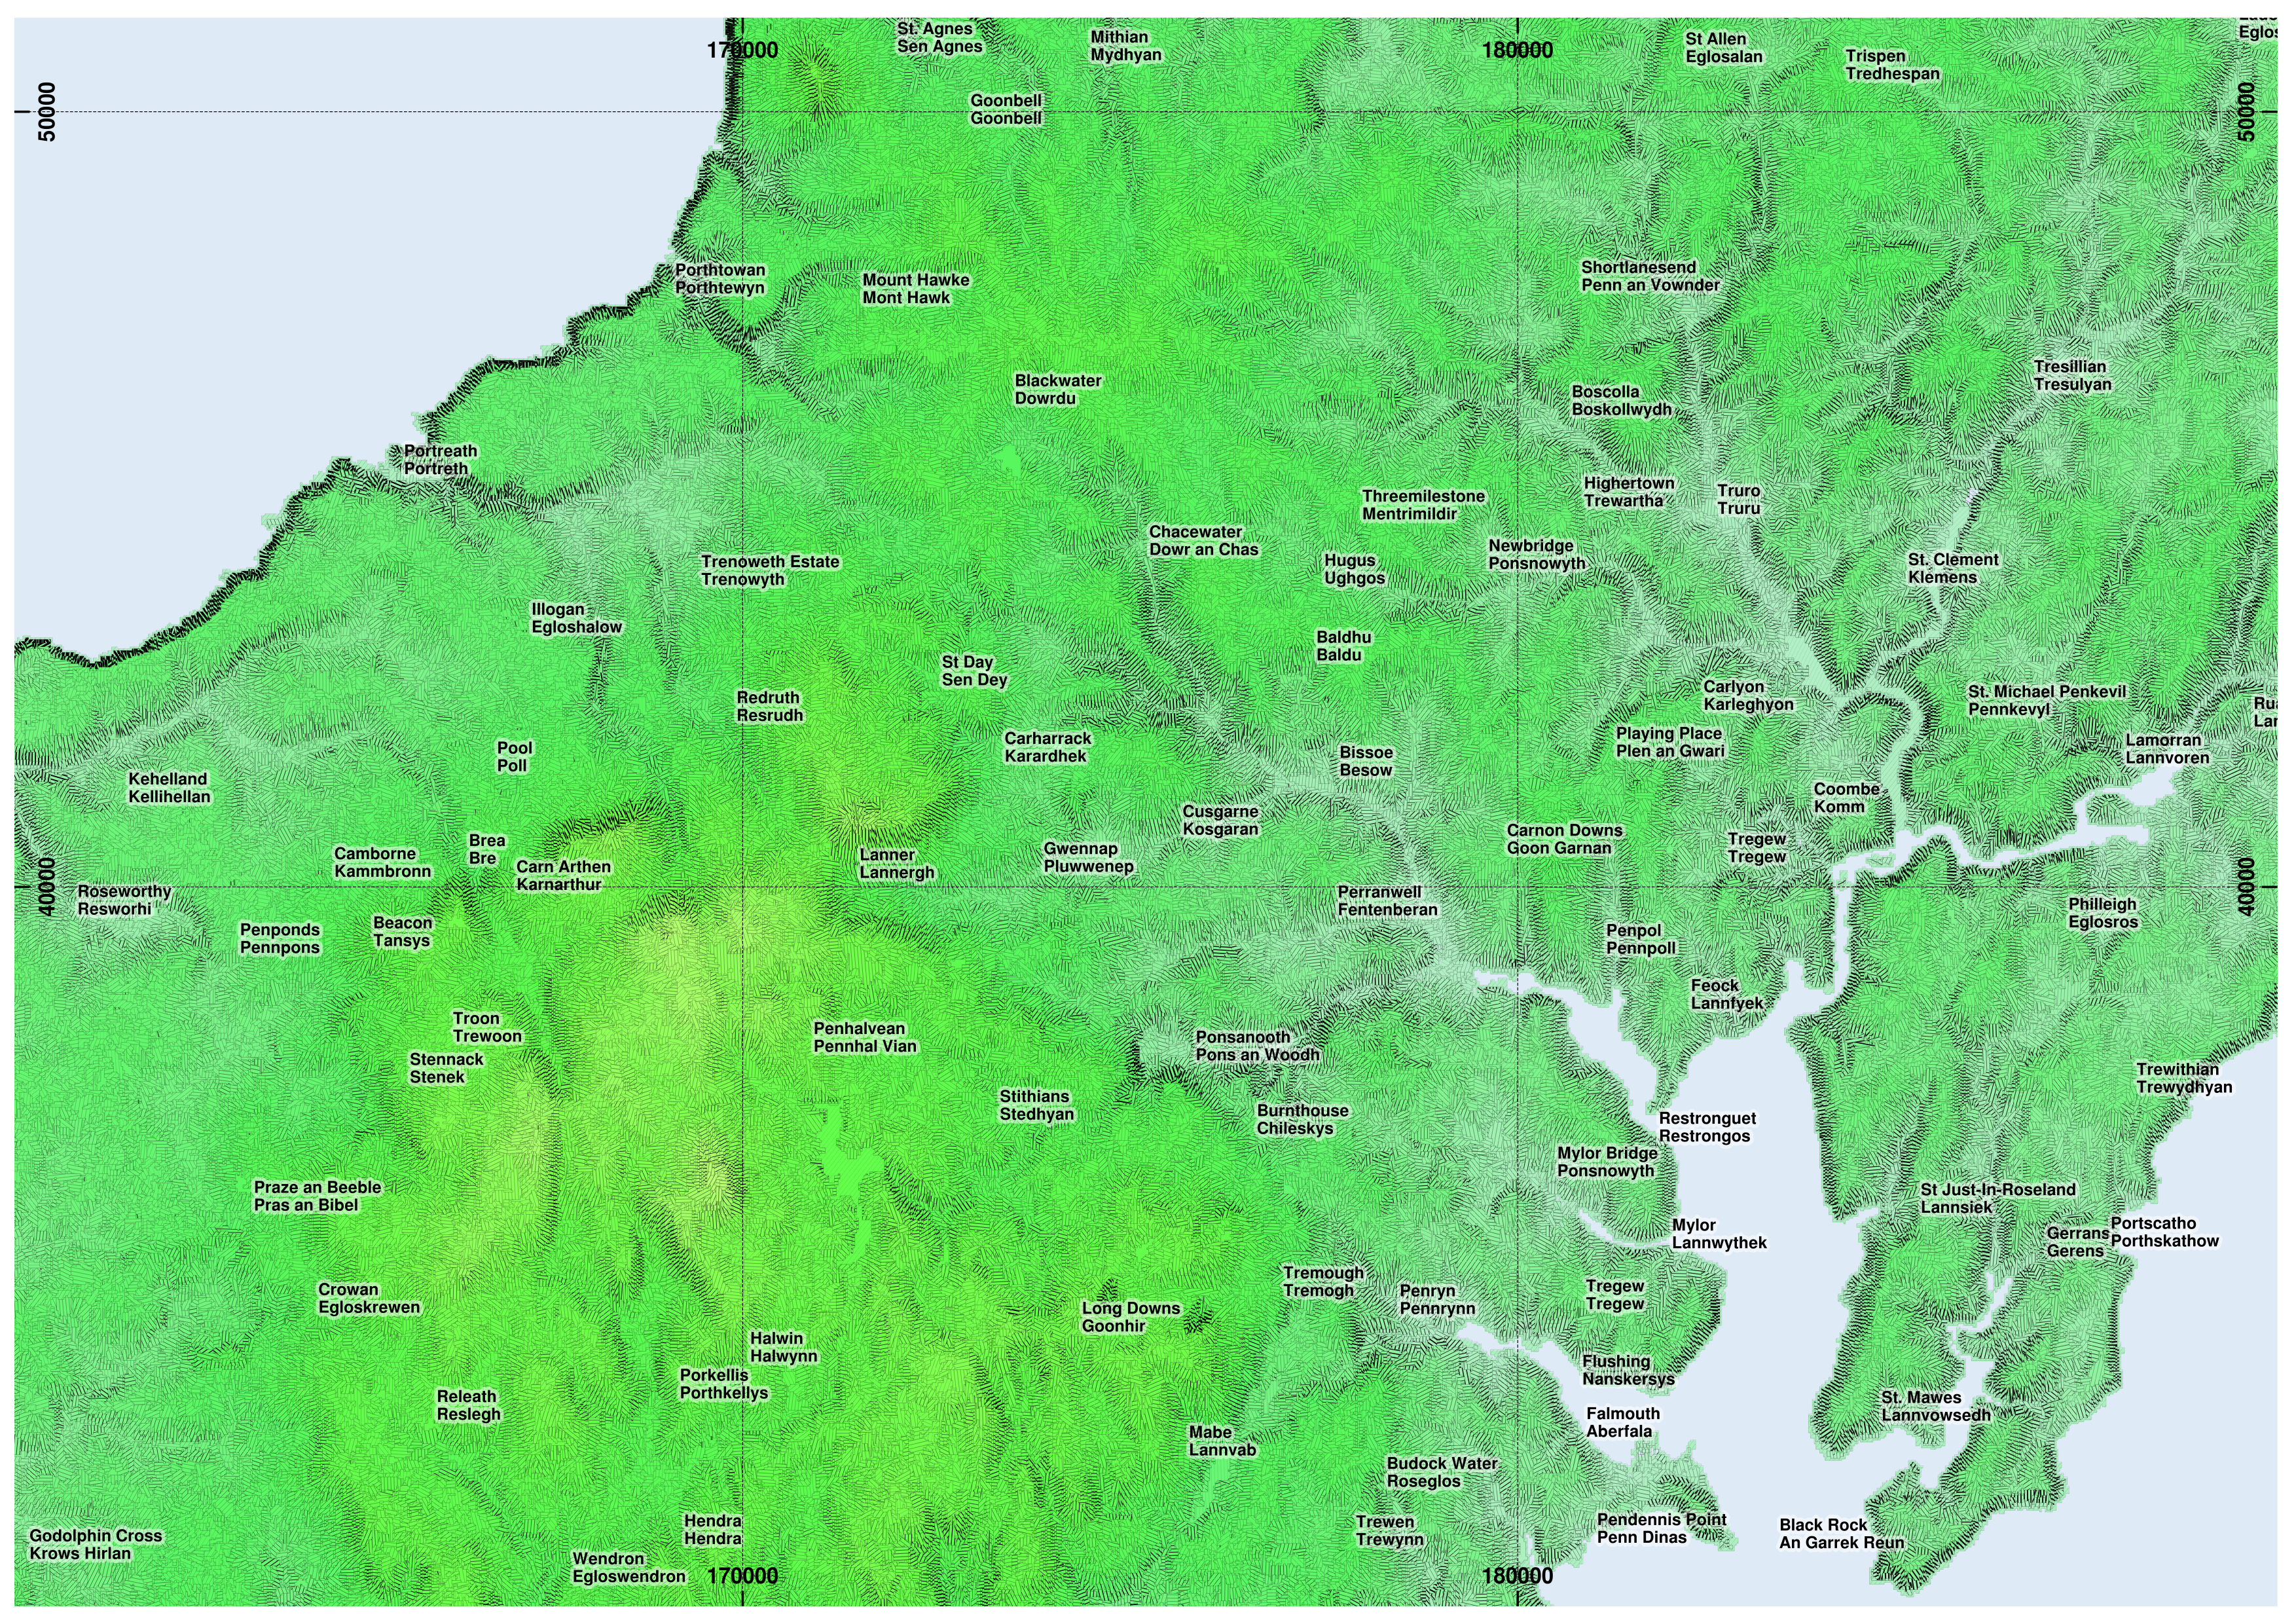
I added a colourisation of the elevation to display that as well. I have neglected to show a key for this, but qualitatively the colour ramp begins with a pale green becoming stronger with increasing altitude up to 200m, with yellow overlaid gradually coming in above 100m up to 300m, then orange/brown comes in up to the maximum of 420m.
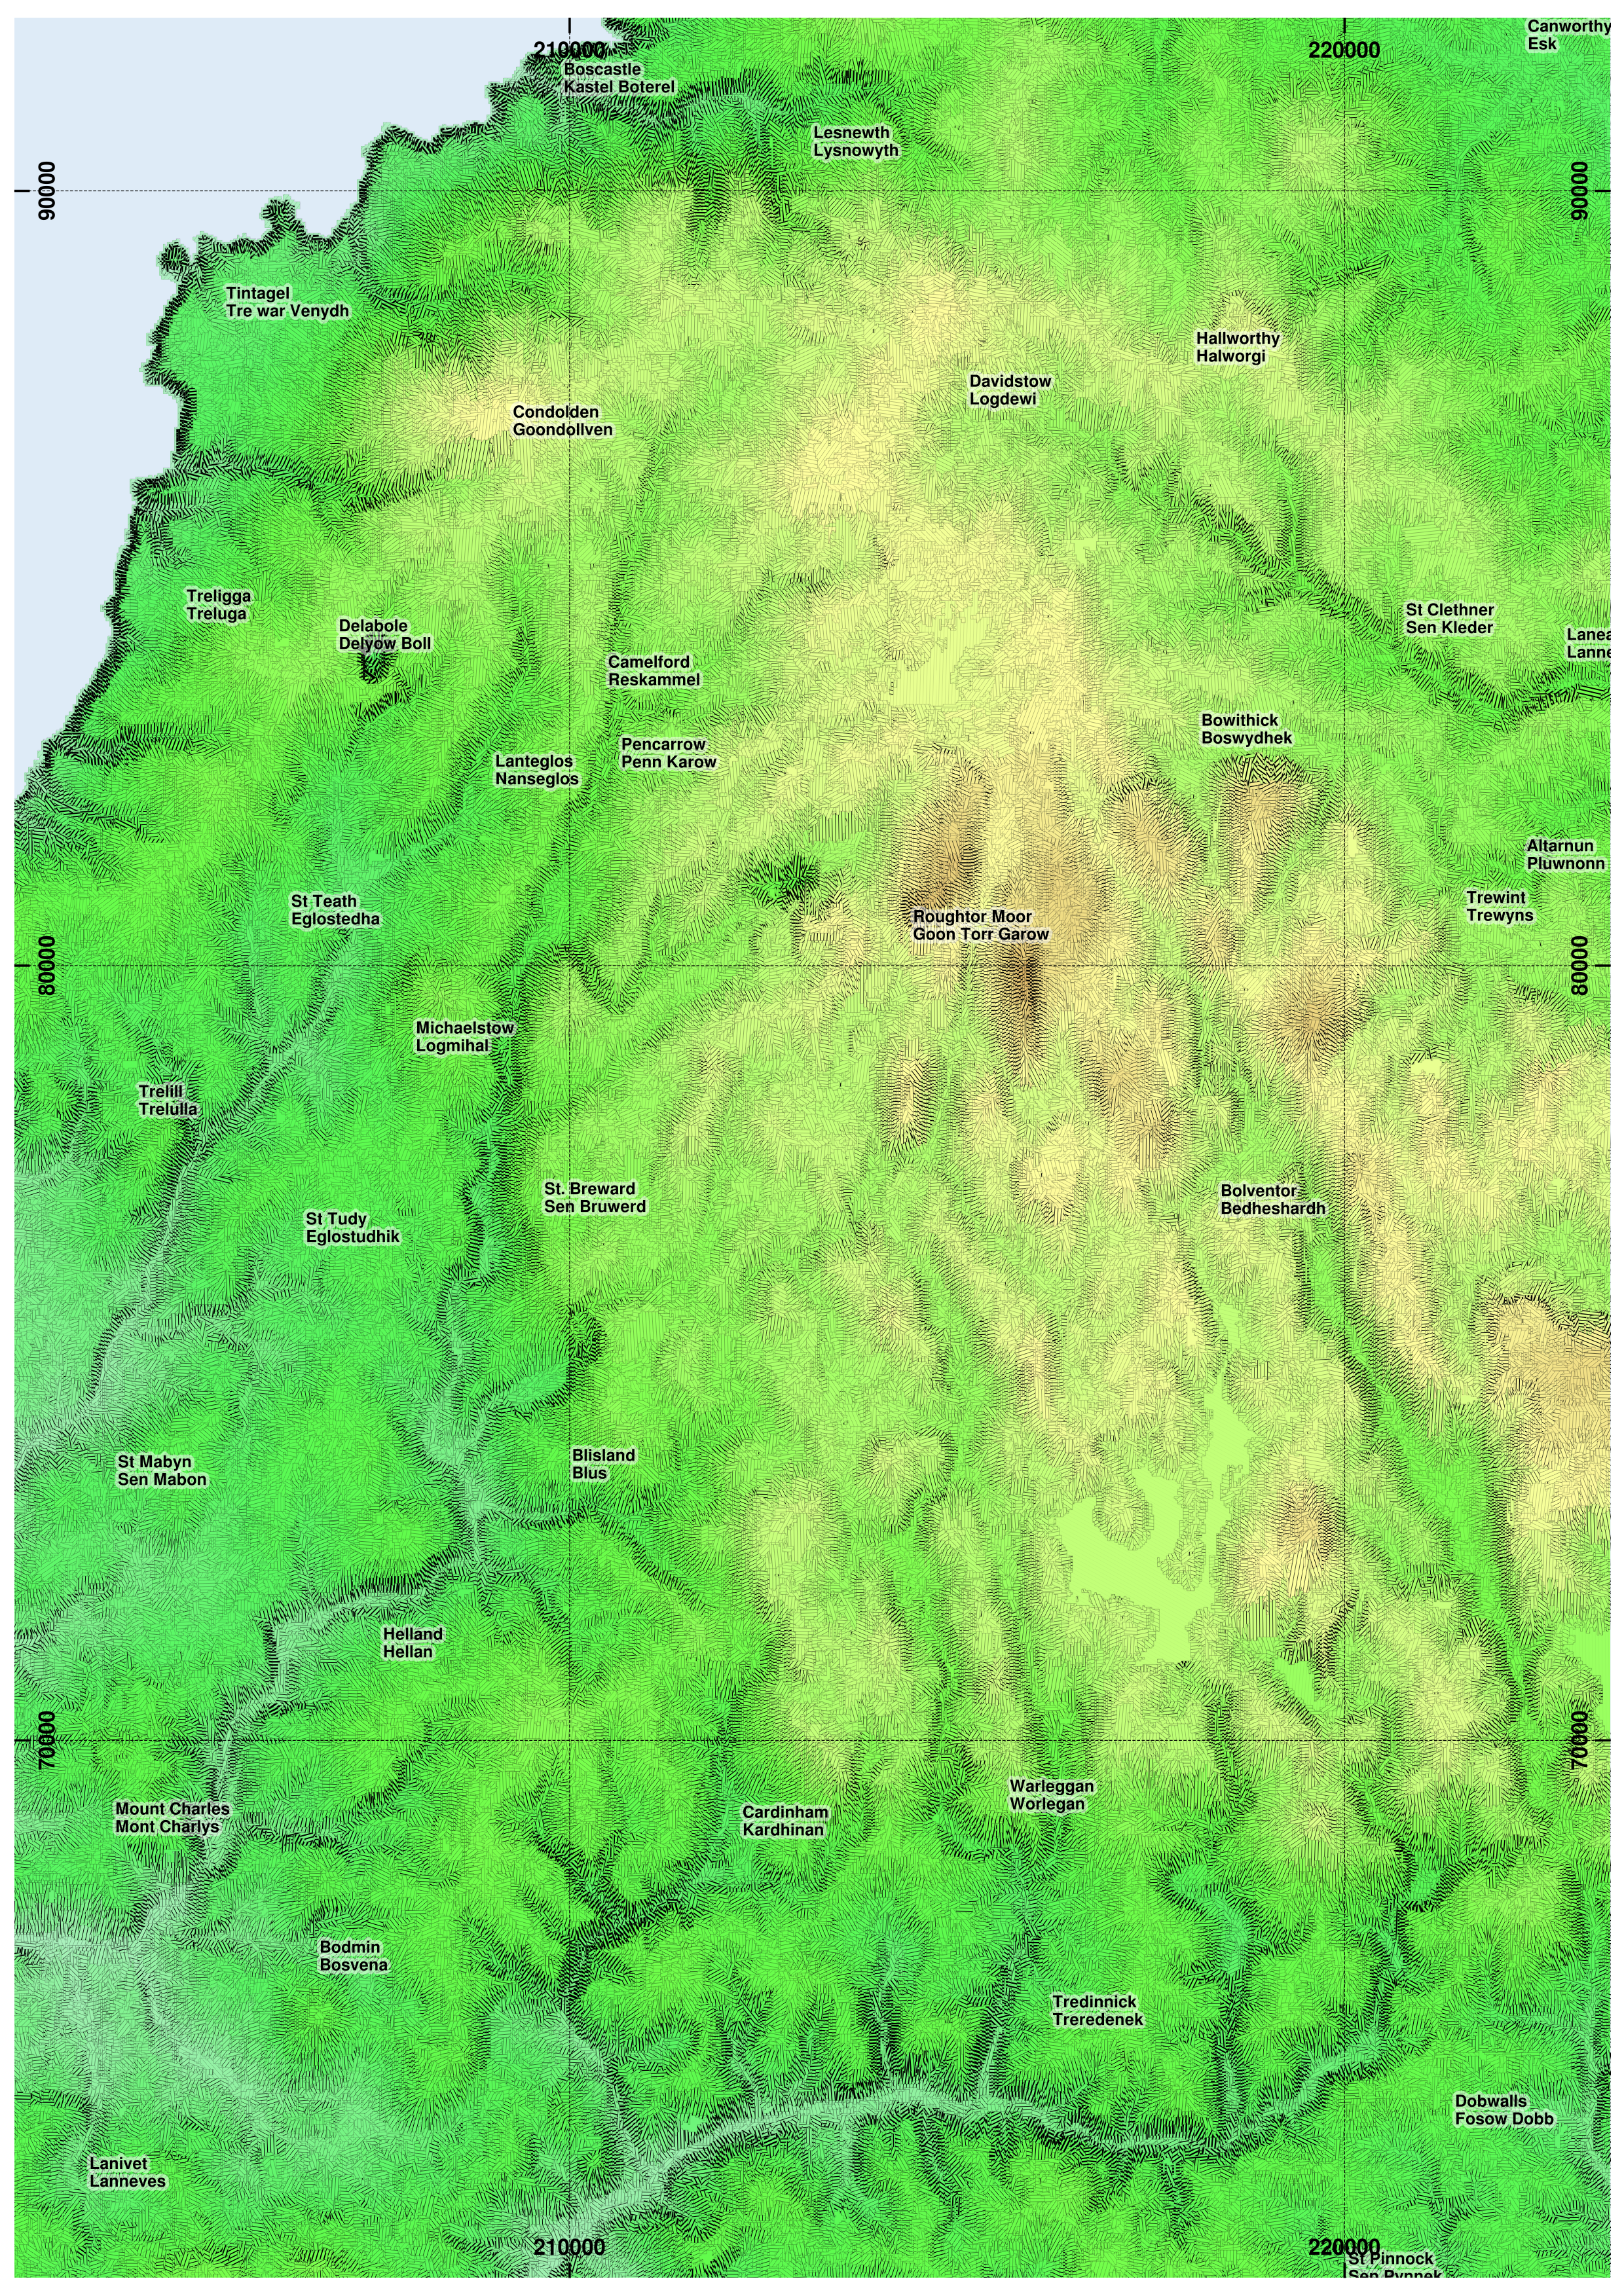
Here are a couple of areas of Cornwall mapped according to this scheme. I have shown segment boundaries lightly (probably only visible on the png versions linked to in the captions) which have a minimum size of 14 pixels, where the pixel size is approximately 24m.
This is not necessarily easy, because both vary continuously across a terrain.
So therefore I thought to use RSGISLib to segment a digital elevation model, that I had derived from SRTM 1 arcsec data, and used GDAL and LandSerf to create derived topographic variables and make a layerstack that consisted of 6 bands:
- Elevation above sea level (m)
- Slope (degrees)
- Aspect (degrees)
- magnitude of Aspect away from N (degrees) - to avoid the 360/0 discontinuity
- Cross-sectional curvature
- Longitudinal curvature
I told RSGISLib to use all bands except band 3 - to avoid the 360/0 discontinuity dominating the segmentation and getting a large number of segments divided along the N/S axis.
After producing the segmented DEM, then it is a matter of using RSGISLib to populate the Mean and StdDev of each band to the raster attribute table of the segment clumps file, and creating a shapefile version using gdal_polygonize and using RSGISLib to export the raster attribute table into a CSV file. There is a fair bit of scripting involved, but I was able to recycle the scripts from my MSc dissertation.
Then I load this up into QGIS, and create some styling rules to show the lines in the direction of the aspect, and thickness according to the steepness of the slope.
I added a colourisation of the elevation to display that as well. I have neglected to show a key for this, but qualitatively the colour ramp begins with a pale green becoming stronger with increasing altitude up to 200m, with yellow overlaid gradually coming in above 100m up to 300m, then orange/brown comes in up to the maximum of 420m.
Here are a couple of areas of Cornwall mapped according to this scheme. I have shown segment boundaries lightly (probably only visible on the png versions linked to in the captions) which have a minimum size of 14 pixels, where the pixel size is approximately 24m.
Truro/Falmouth area
 |
| A larger version, showing a wider area including Redruth/Camborne (14MB PNG). |
Part of N coast and Bodmin Moor
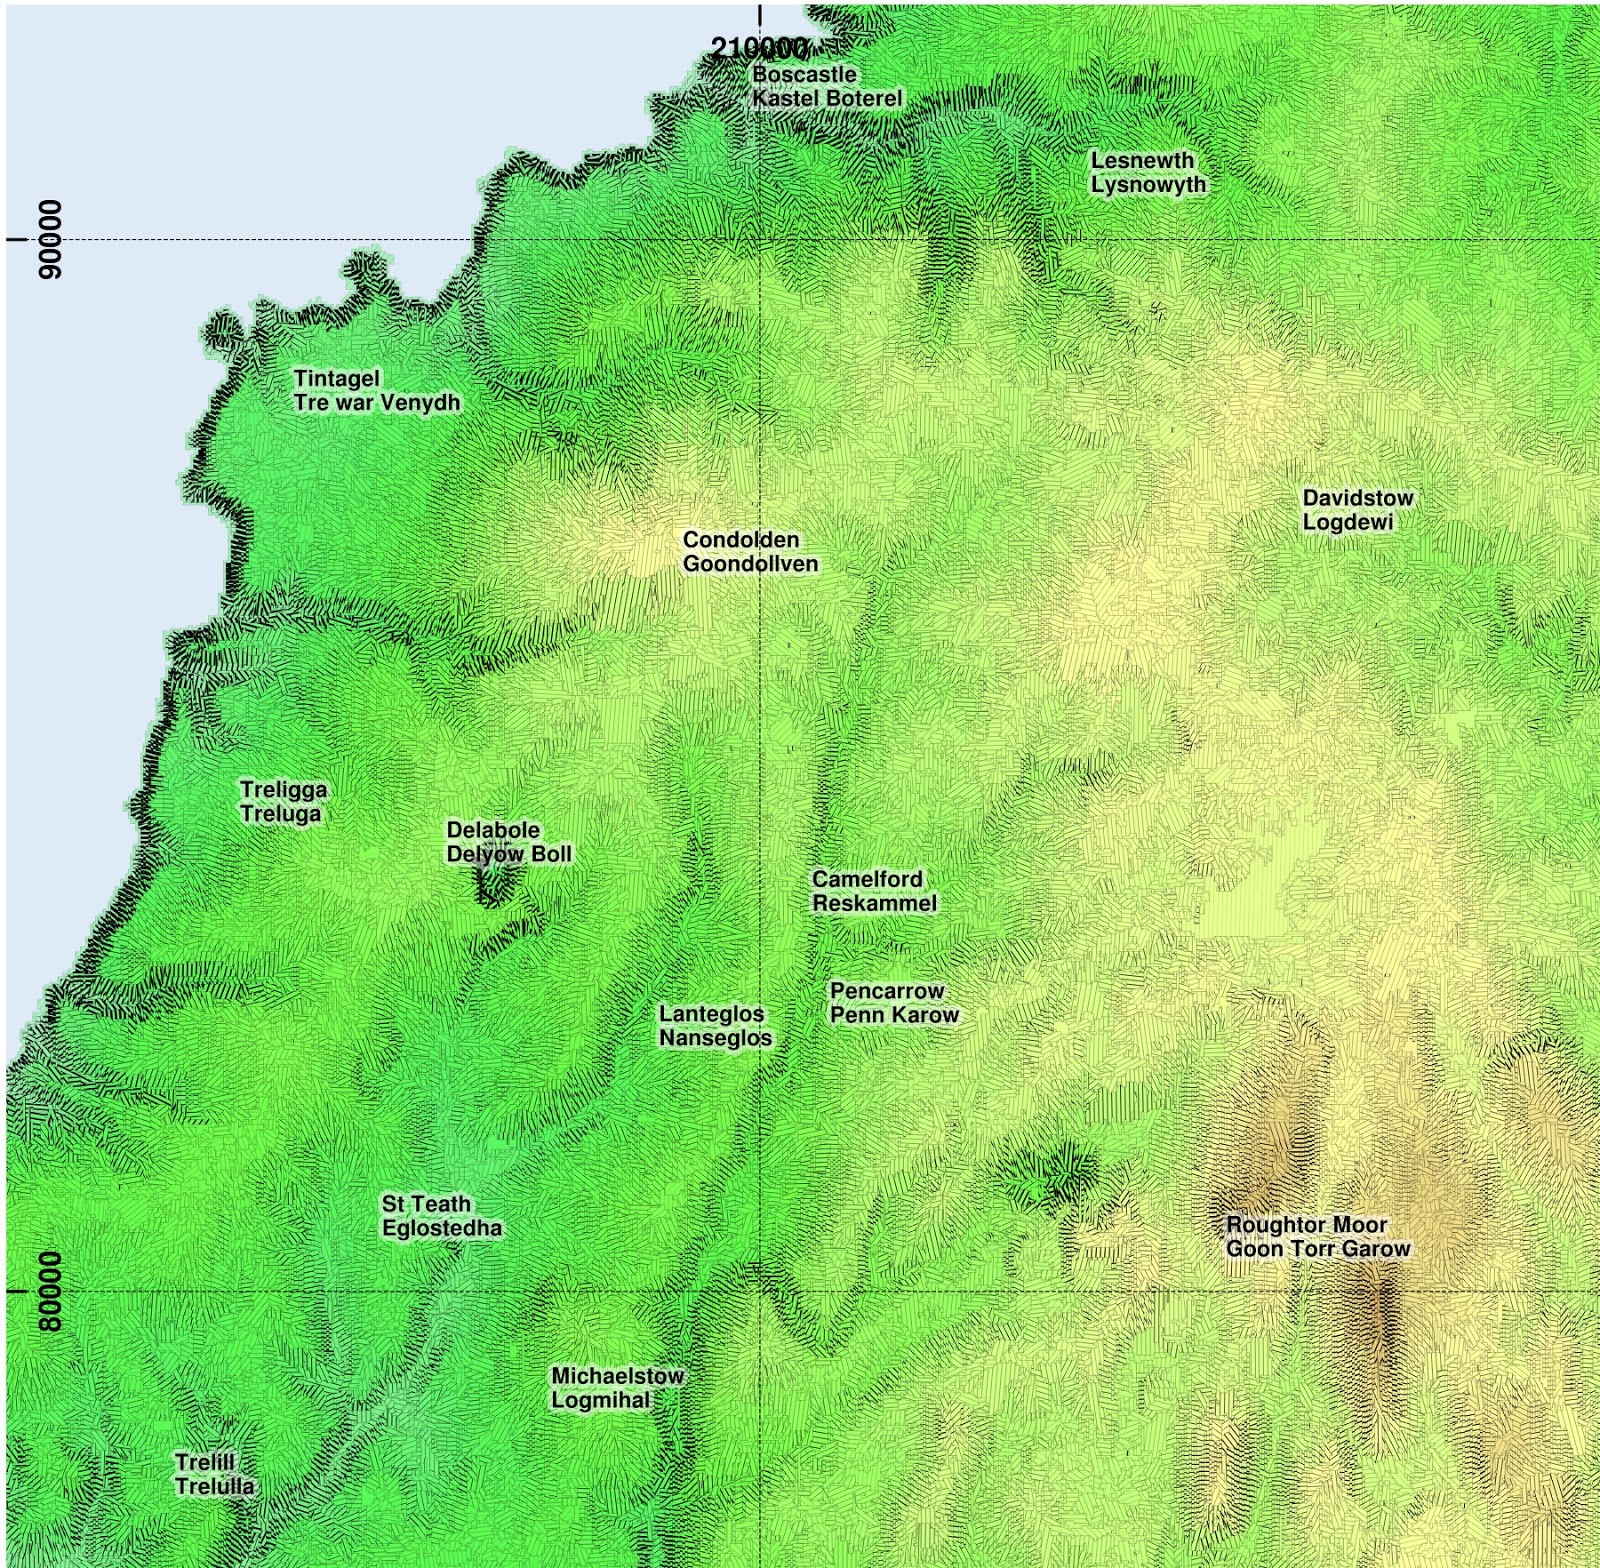 |
| A larger version, showing a wider area (16MB PNG). |
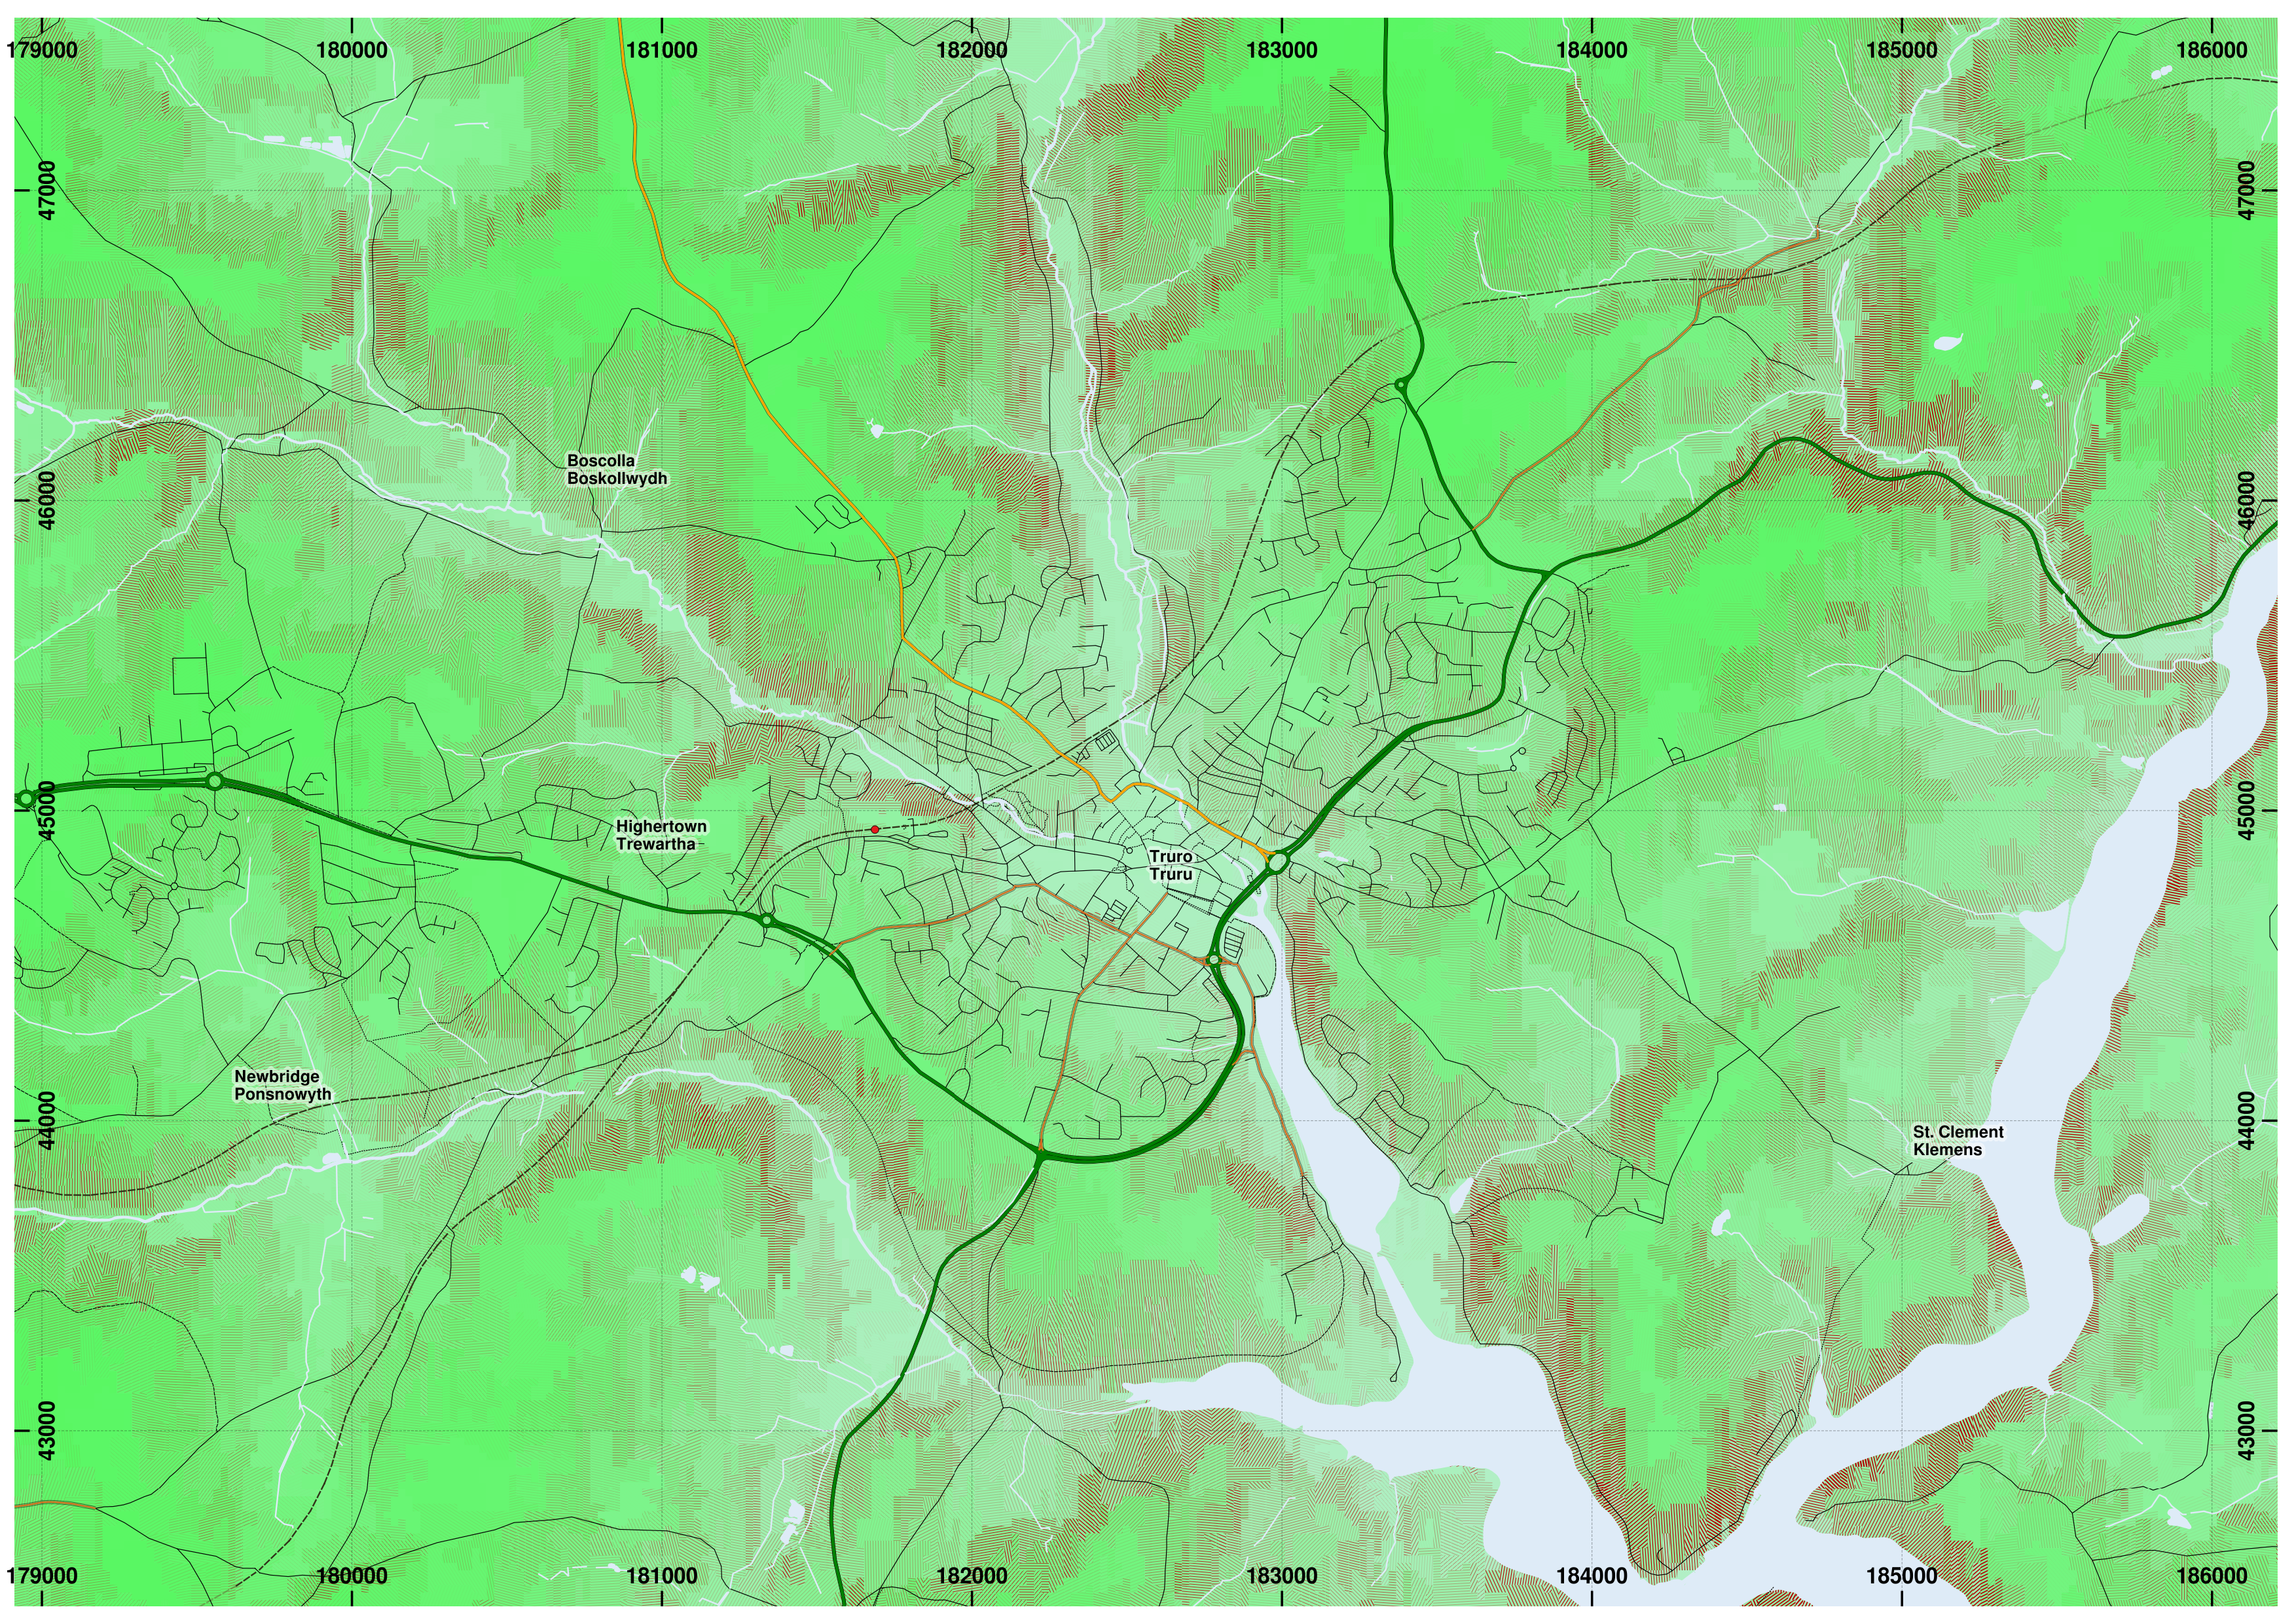
Close up of Truro area, rendered at 1:25000
Here is a version, with the roads added from OpenStreetMap, and inland and tidal water added from OS VectorMap, rendered at 1:25k with a modified spacing of slope lines which now are removed entirely where the mean slope in a segment is less than 2.25 degrees (1 in 20), and plotted in a shade of red in an effort to avoid confusion with minor roads. The segment boundaries are also no longer plotted.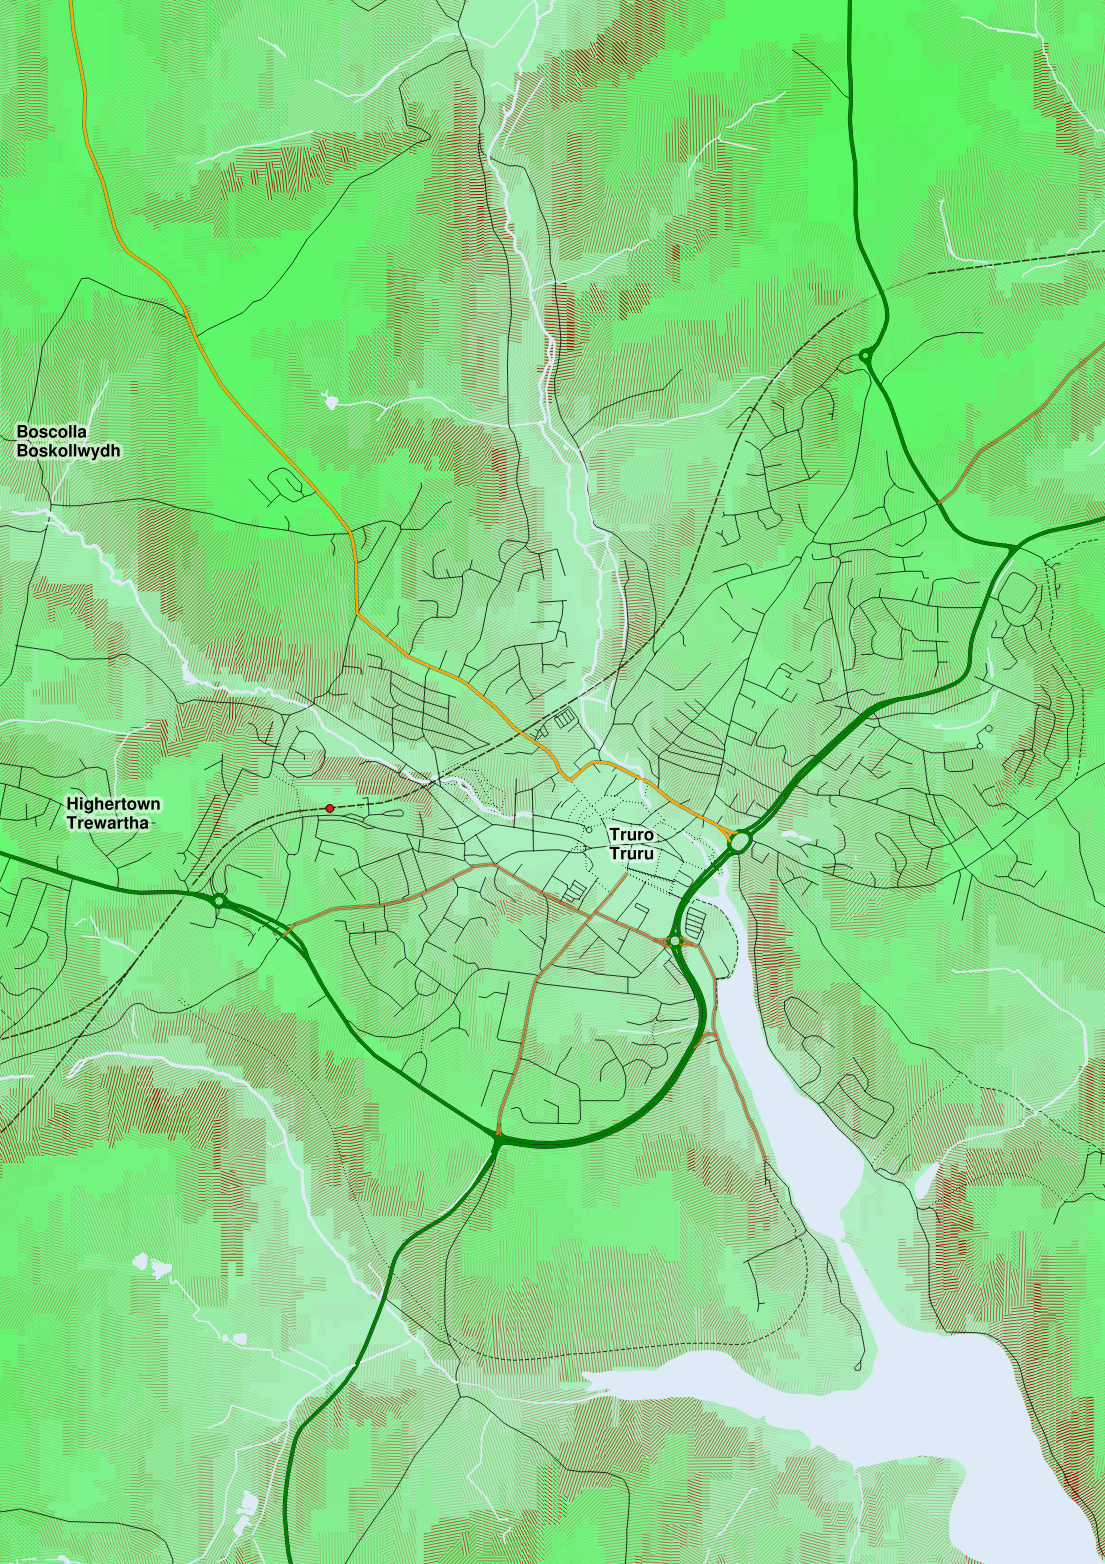 |
| A larger version, rendered at a higher resolution, covering a somewhat wider area (7.6MB PNG). |
Redruth, and the north face of Carn Brea
 |
| The elevation scale is modified such that darker green is lower in this rendering, moving to light green, through yellow and then orange as before. The north face of Carn Brea shows areas of steep slope, which can sometimes suffer from gorse fires. |
Ebrenn y'n Nos - mis-Est 2015
This is a transcript of the second part of a series I am doing for Radyo An Gernewegva about the night sky and space exploration. There a few extra parts here that were removed as I shortened it for the podcast.
Ottomma an nessa rann a'm kevres a-dro dhe'n ebrenn nos ha nowodhow a-dhiworth an bys steronieth ha hwilans spas.
Dalleth mis-Est yw Lammas y'n kalendar keltek, dhe verkya hanter-fordh ynter Golowan ha'n kehysnos kynyav. An jydh y honan yw dy'kalann Est, mes yn hwir bos seythves mis-Est hanter an termyn yntra'n howlsav ha'n kehysnos yn poran.
Y'n ebrenn wosa hi dhe dewlhe, yma trihorn a sterennow splann. Hemm yw an 'Trihorn Hav', ow komprehendya an sterennow Vega y'n ranneves Lyra (daffar ilow kepar ha telyn), Deneb yn ranneves Cygnus (an Alargh), hag Altair yn Aqulia (an Er). Kynth yw an sterennow ma ogas dhe'n keth splannder heveladow y'n ebrenn, nyns yns i an keth splennyjyon yn spas, drefenn bos Altair sterenn ogas dhyn ni, 17 bloodh-wolow diworthyn, ha Deneb yw sterenn pell, moy ages 2000 bloodh-wolow diworthyn. Deneb yw sterenn kowr, gorgowr yn hwir, gans splennyjyon pur ughel, hanterkans milgweyth an howl. Mars yw an ebrenn tewl lowr, gweladow yn ta yw 'Fordh Sen Jamys' yn rannevesow Cygnus, Altair, ha Saggitarius avel kommol niwlek, mes yn gwirionedh yth yw milyow a sterennow pell yn disk agan galaksi.
Kresenn an galaksi yw yn ranneves Saggitarius mes nyns yw gweladow an gresenn y honan. Yma kommol gas ha doust y'gan galaksi, ha meur anedha ogas dhe'n kresenn. Dres henna nyns yw possybl dhe weles y'n tu na gans golow gweladow mes possybl yw y'n is-rudh, drefenn golow an par na dhe dhewana an kommol yn esya. Yma nebes sterennow a wra resek pur uskis ogas dhe gres an galaksi, ha dres henna ni a woer eus neppyth pur boos ena. Dell hevel, ny yll henna bos travyth marnas 'toll du'.
Yma kowas sterennow kodha yn mis-Est, henwys an Perseids. An gwella chons aga gweles vydh an 12ves bys dhe'n 14ves mis-Est. Ny vydh an loor y'n ebrenn ena, ytho y fydh gwel da anedha mar pydh an gewer da, bys dhe tri ugens anedha gweladow pub our, hag i a wra dos a-dhiworth tu an rannneves Perseus.
An planet Sadorn yw gweladow hwath, isel y'n soth y'n gorthugher, mes y hwra ev sedha a-varra yn termyn usi ow tos. Yn dalleth an mis y hwra sedha dhe unn eur myttin, ha dhe'n diweth unnek our nos.
Gans an loor yma kwartron diwettha dhodho 7ves mis-Est, loor nowydh 14ves mis-Est, an kynsa kwartron 22a mis-Est, ha loor leun arta vydh 29ves mis-Est.
An efanvos New Horizons a sewenas dresnija Pluton dhe'n 14ves mis-Gortheren ha studhya an planet ha'y loryow. Ev a welas rew dowr war enep Pluton, mes yn oor na, ogas dhe -235 C, an rew na yw moy kepar ha karrek es rew. Yma rew nitrojen, karbon monoksid ha methan a dhevera avel rewlivow.
Yma nebes tollow skwatt war Pluton ha'y loor bras Charon, mes yma ranndiryow gwastas ha leven, gans enep yowynk yn istori system howlek, martesen saw kans milvil bloodh po le. Yn sur yma fenten tommder ena a wra teudhi an rew ha dres henna dasenebi an enep. Y hyll bos dowr linyel a-ji dhe Bluton.
Yma nebes ayrgylgh tanow methan ha nitrojen, mes ha Pluton dhe bellhe diworth an howl, an gassow na dhe rewi war an enep.
Bagas steronydhyon a wrug diskudha planet a wra resek a-dro dhe sterenn arall, neb yw an moyha kehaval dhe'n norvys hwath diskudhys. An planet yw aswonnys avel Kepler-452b, gans gwradh a-dro dhe 1.6 kweth gwradh an norvys. Ev a resek a-dro dhe sterenn klass G, kepar hag an howl, hag a dhurya 385 dydh dhe dreyla a-dro y resegva. Possybl eus dowr linyel war enep an planet na, ha martesen chons bywnans. Nyns yw kler po an gronnedh poran, po gis an enep. An gronnedh yw ynter 3 ha 7 kweth gronnedh an norvys. An paper yn y gever o skrifys gans steronydh Jon Jenkins yn kynsa, hag onan an kesskriforyon yw Jason Rowe. (kevrenn http://arxiv.org/abs/1507.06723)
Mars eus gwreydh kernewek dhedha, ny viens i an kynsa Kernow dhe dhiskudha planet. Den a Gernow John Couch Adams a wrug awrgrymya le planet Neptun kyns y vos gwelys y'n nownsegves kansblydhen.
Henn yw oll an mis ma, govenek a'm beus bos an gewer kler. Bys nessa prys.
Ottomma an nessa rann a'm kevres a-dro dhe'n ebrenn nos ha nowodhow a-dhiworth an bys steronieth ha hwilans spas.
Dalleth mis-Est yw Lammas y'n kalendar keltek, dhe verkya hanter-fordh ynter Golowan ha'n kehysnos kynyav. An jydh y honan yw dy'kalann Est, mes yn hwir bos seythves mis-Est hanter an termyn yntra'n howlsav ha'n kehysnos yn poran.
Y'n ebrenn wosa hi dhe dewlhe, yma trihorn a sterennow splann. Hemm yw an 'Trihorn Hav', ow komprehendya an sterennow Vega y'n ranneves Lyra (daffar ilow kepar ha telyn), Deneb yn ranneves Cygnus (an Alargh), hag Altair yn Aqulia (an Er). Kynth yw an sterennow ma ogas dhe'n keth splannder heveladow y'n ebrenn, nyns yns i an keth splennyjyon yn spas, drefenn bos Altair sterenn ogas dhyn ni, 17 bloodh-wolow diworthyn, ha Deneb yw sterenn pell, moy ages 2000 bloodh-wolow diworthyn. Deneb yw sterenn kowr, gorgowr yn hwir, gans splennyjyon pur ughel, hanterkans milgweyth an howl. Mars yw an ebrenn tewl lowr, gweladow yn ta yw 'Fordh Sen Jamys' yn rannevesow Cygnus, Altair, ha Saggitarius avel kommol niwlek, mes yn gwirionedh yth yw milyow a sterennow pell yn disk agan galaksi.
 | |
| An Trihorn Hav. Mappa ster gwrys gans Cartes du Ciel |
Yma kowas sterennow kodha yn mis-Est, henwys an Perseids. An gwella chons aga gweles vydh an 12ves bys dhe'n 14ves mis-Est. Ny vydh an loor y'n ebrenn ena, ytho y fydh gwel da anedha mar pydh an gewer da, bys dhe tri ugens anedha gweladow pub our, hag i a wra dos a-dhiworth tu an rannneves Perseus.
An planet Sadorn yw gweladow hwath, isel y'n soth y'n gorthugher, mes y hwra ev sedha a-varra yn termyn usi ow tos. Yn dalleth an mis y hwra sedha dhe unn eur myttin, ha dhe'n diweth unnek our nos.
 |
| Sterenn ow kodha Perseid a-ugh an "Pellweler Pur Vras" (VLT) yn Chili. Imaj diworth ESO / S. Guisard yn 'Astronomy Now'. |
Gans an loor yma kwartron diwettha dhodho 7ves mis-Est, loor nowydh 14ves mis-Est, an kynsa kwartron 22a mis-Est, ha loor leun arta vydh 29ves mis-Est.
An efanvos New Horizons a sewenas dresnija Pluton dhe'n 14ves mis-Gortheren ha studhya an planet ha'y loryow. Ev a welas rew dowr war enep Pluton, mes yn oor na, ogas dhe -235 C, an rew na yw moy kepar ha karrek es rew. Yma rew nitrojen, karbon monoksid ha methan a dhevera avel rewlivow.
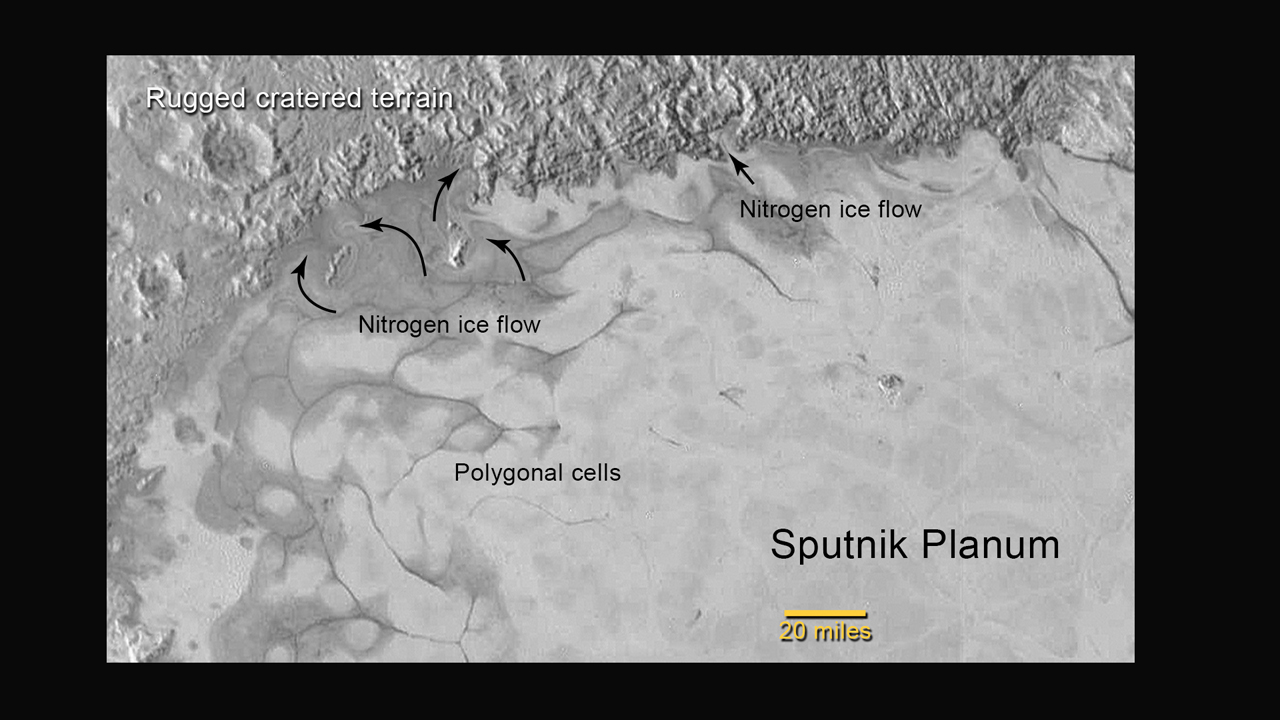 |
| Enep Pluton gans rewlivow nitrojen. Moy diworth gwiasva NASA New Horizons. |
Yma nebes tollow skwatt war Pluton ha'y loor bras Charon, mes yma ranndiryow gwastas ha leven, gans enep yowynk yn istori system howlek, martesen saw kans milvil bloodh po le. Yn sur yma fenten tommder ena a wra teudhi an rew ha dres henna dasenebi an enep. Y hyll bos dowr linyel a-ji dhe Bluton.
Gwydheo dresnija Pluton (simulatys) gans NASA
Yma nebes ayrgylgh tanow methan ha nitrojen, mes ha Pluton dhe bellhe diworth an howl, an gassow na dhe rewi war an enep.
Bagas steronydhyon a wrug diskudha planet a wra resek a-dro dhe sterenn arall, neb yw an moyha kehaval dhe'n norvys hwath diskudhys. An planet yw aswonnys avel Kepler-452b, gans gwradh a-dro dhe 1.6 kweth gwradh an norvys. Ev a resek a-dro dhe sterenn klass G, kepar hag an howl, hag a dhurya 385 dydh dhe dreyla a-dro y resegva. Possybl eus dowr linyel war enep an planet na, ha martesen chons bywnans. Nyns yw kler po an gronnedh poran, po gis an enep. An gronnedh yw ynter 3 ha 7 kweth gronnedh an norvys. An paper yn y gever o skrifys gans steronydh Jon Jenkins yn kynsa, hag onan an kesskriforyon yw Jason Rowe. (kevrenn http://arxiv.org/abs/1507.06723)
 |
| Gwel artek Kepler-452b (deghow) ha'n norvys (kledh). Diworth NASA/Ames/JPL-Caltech |
Mars eus gwreydh kernewek dhedha, ny viens i an kynsa Kernow dhe dhiskudha planet. Den a Gernow John Couch Adams a wrug awrgrymya le planet Neptun kyns y vos gwelys y'n nownsegves kansblydhen.
Henn yw oll an mis ma, govenek a'm beus bos an gewer kler. Bys nessa prys.
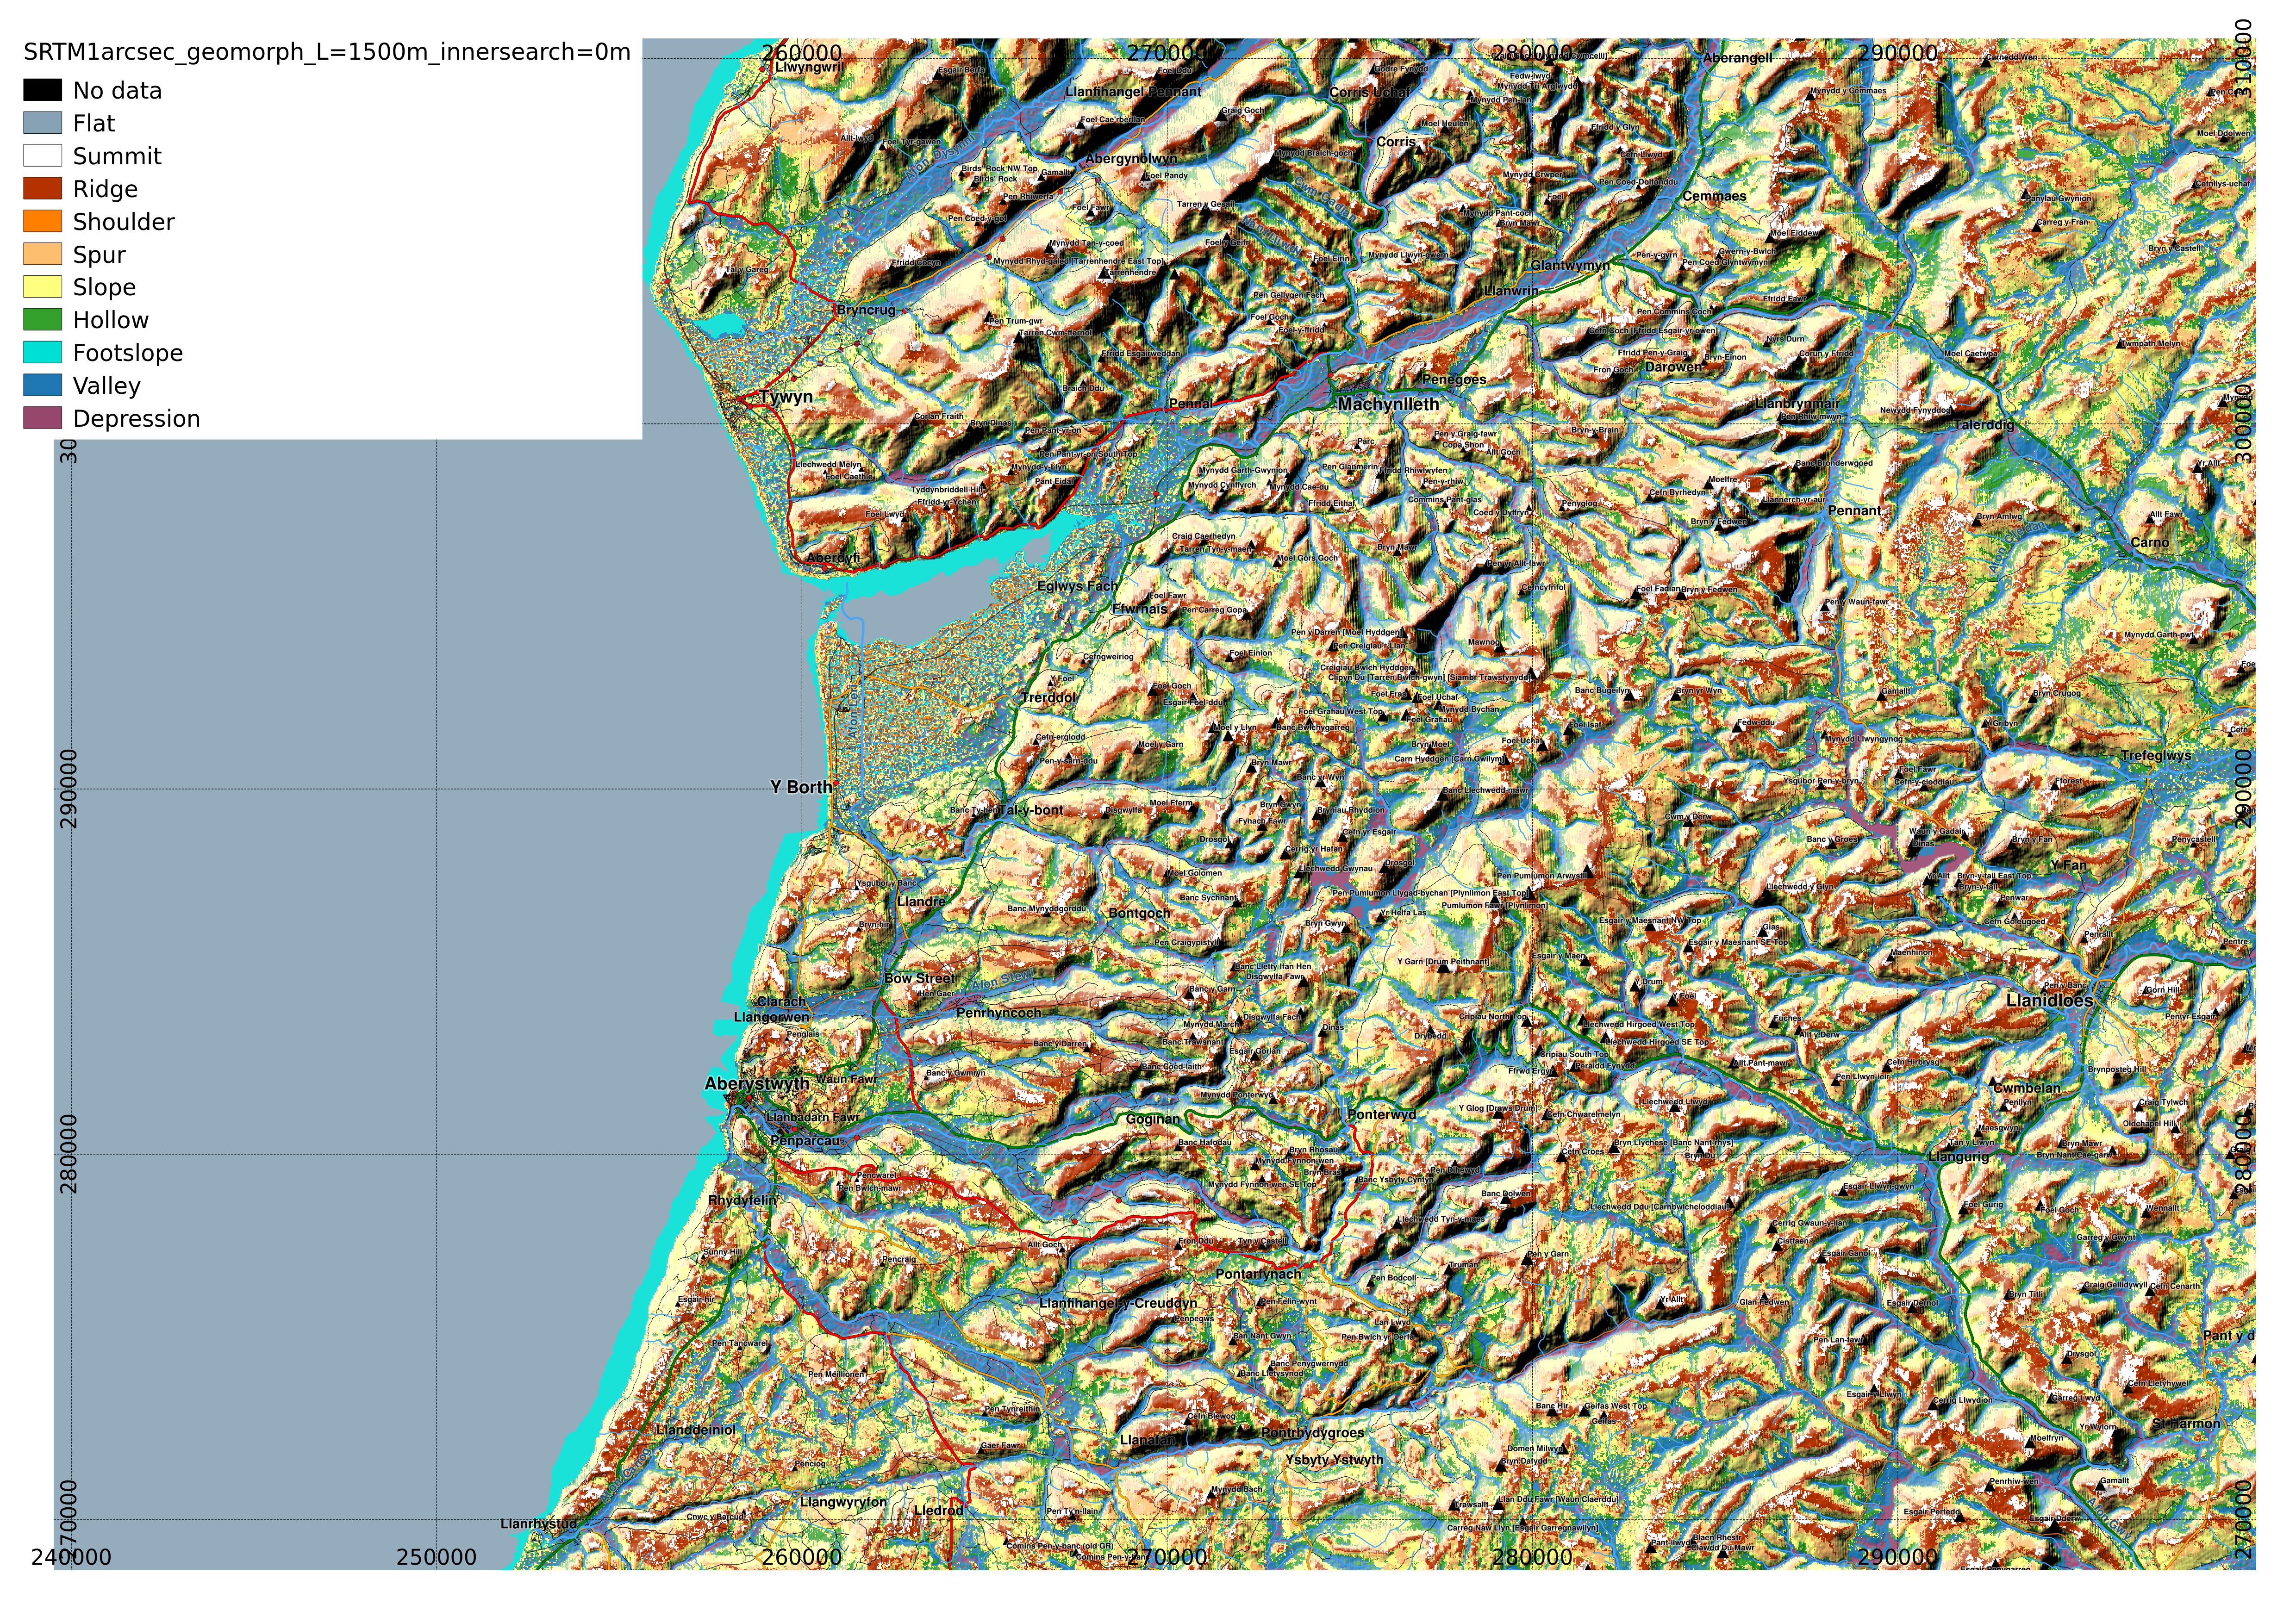
A bit more on geomorphons, varying the 'inner search radius'
I had originally posted maps of DEMs of Cornwall and the Aberystwyth area of mid-Wales processed using Tomasz Stepinski et al.'s geomorphon method as descibed in the papers of: Stepinski+Jasiewicz 2011, Jasiewicz + Stepinski 2013.
Since then I have become aware of the 1 arcsecond SRTM data being available, so I have recalculated the geomorphons and here show the map of the same area of mid-Wales that the landcover assignment from my MSc was concerned with.
Using the search distance L=1500m, as did T. Stepinski in his geomorphon map of Poland (user guide), I varied the 'inner search radius' which determines the minimum distance the software looks, using 0, 2 and 4 cells. 1 cell is ~ 24m in the SRTM 1 arcsec data after conversion to OS grid reference coordinates.
I expect it would be interesting to combine it with the segmentation and classification with RSGISlib and to examine correlations between the landscape position of a location, and the land-cover.
Since then I have become aware of the 1 arcsecond SRTM data being available, so I have recalculated the geomorphons and here show the map of the same area of mid-Wales that the landcover assignment from my MSc was concerned with.
Using the search distance L=1500m, as did T. Stepinski in his geomorphon map of Poland (user guide), I varied the 'inner search radius' which determines the minimum distance the software looks, using 0, 2 and 4 cells. 1 cell is ~ 24m in the SRTM 1 arcsec data after conversion to OS grid reference coordinates.
Inner search radius 0m
 |
| In some of the flatter areas results are difficult to interpret. full-resolution image. |
Inner search radius 2 cells (~50m)
 |
| Looking in Borth Bog, more of the area is shown as 'Flat' full-resolution image. |
Inner search radius 4 cells (~100m)
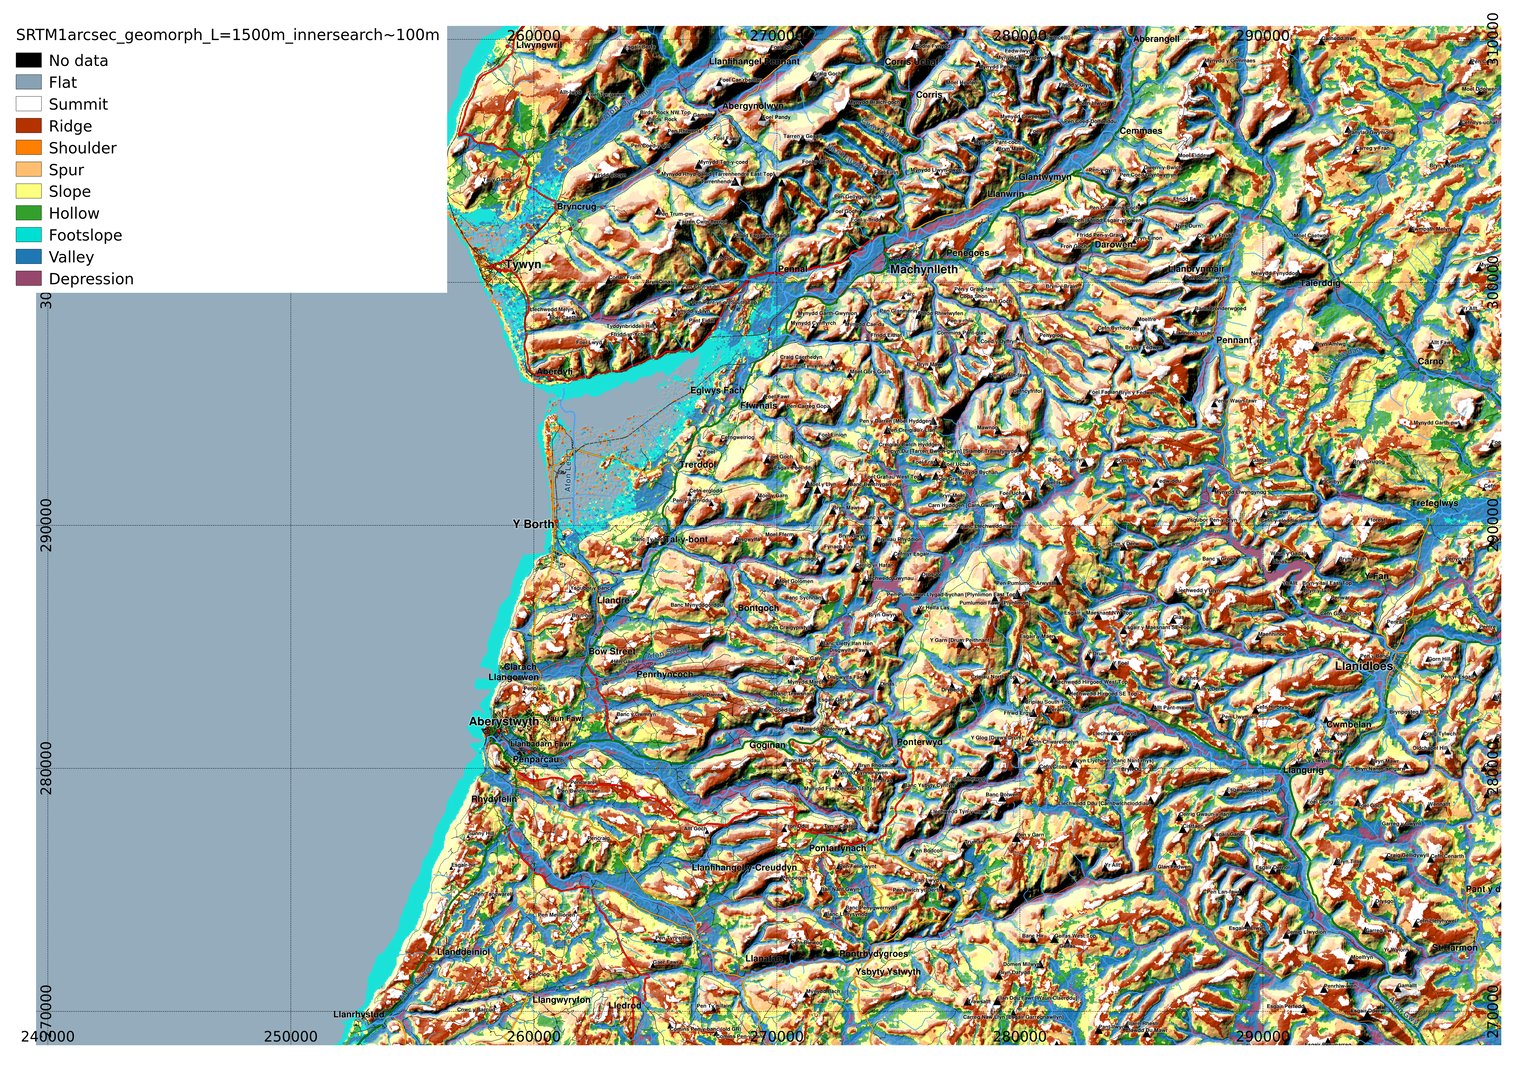 | |
| As the inner search radius is expanded to 4 cells, most of the possibly spurious peaks in the flat area of Borth Bog disappear. full-resolution image. |
I expect it would be interesting to combine it with the segmentation and classification with RSGISlib and to examine correlations between the landscape position of a location, and the land-cover.
Revisiting geomorphons - with 1 arcsecond SRTM data
I had originally posted maps of DEMs of Cornwall and the Aberystwyth area of mid-Wales processed using Tomasz Stepinski et al.'s geomorphon method.
Since then I have become aware of the 1 arcsecond SRTM data being available, so I have recalculated the geomorphons and present some maps of Cornwall here.
I've also become more aware of the various layer blending methods in QGIS which has allowed me to blend it with a hill-shaded topography layer.
In these maps, the search distance L = 1500m, flatness threshold 1 degree.
 |
| West Cornwall. Full resolution image. |
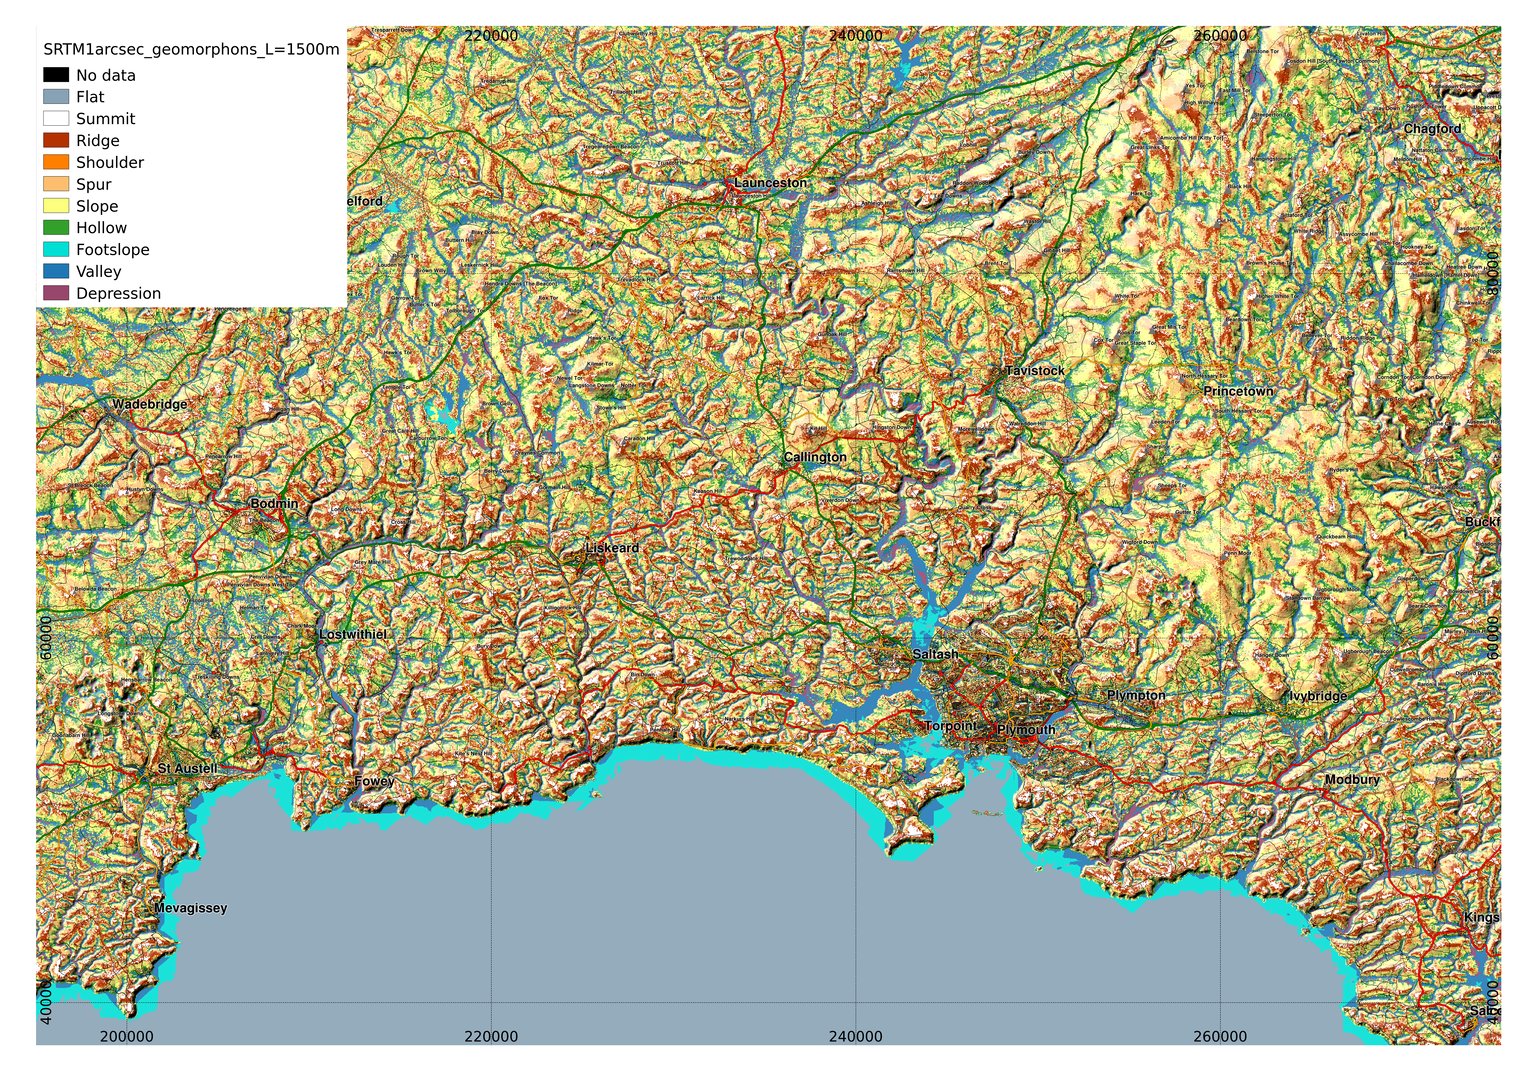 |
| SE Cornwall, Tamar valley and Dartmoor. Full-resolution image. |
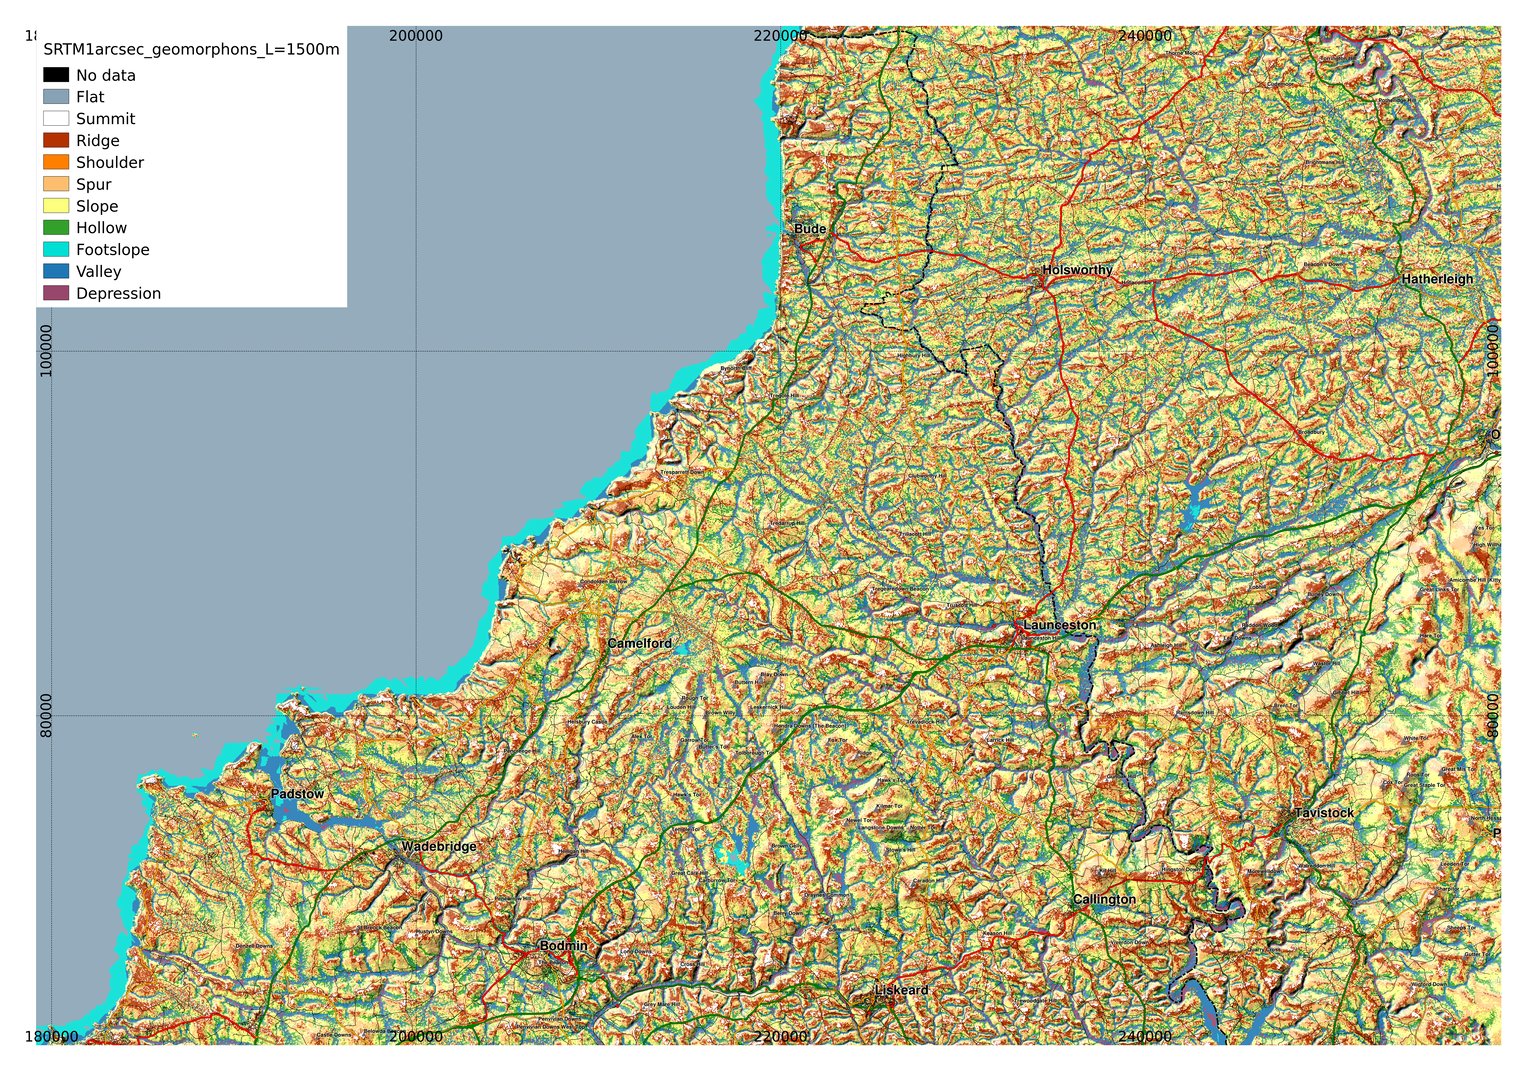 |
| North Cornwall. Full-resolution image. |
Minimum search radius
It is possible to specify an 'inner search radius' that ensures a minimum search radius for the geomorphons. In the maps below, using a minimum search radius of 2 cells (about 50m for this data), this makes the map look a little less noisy: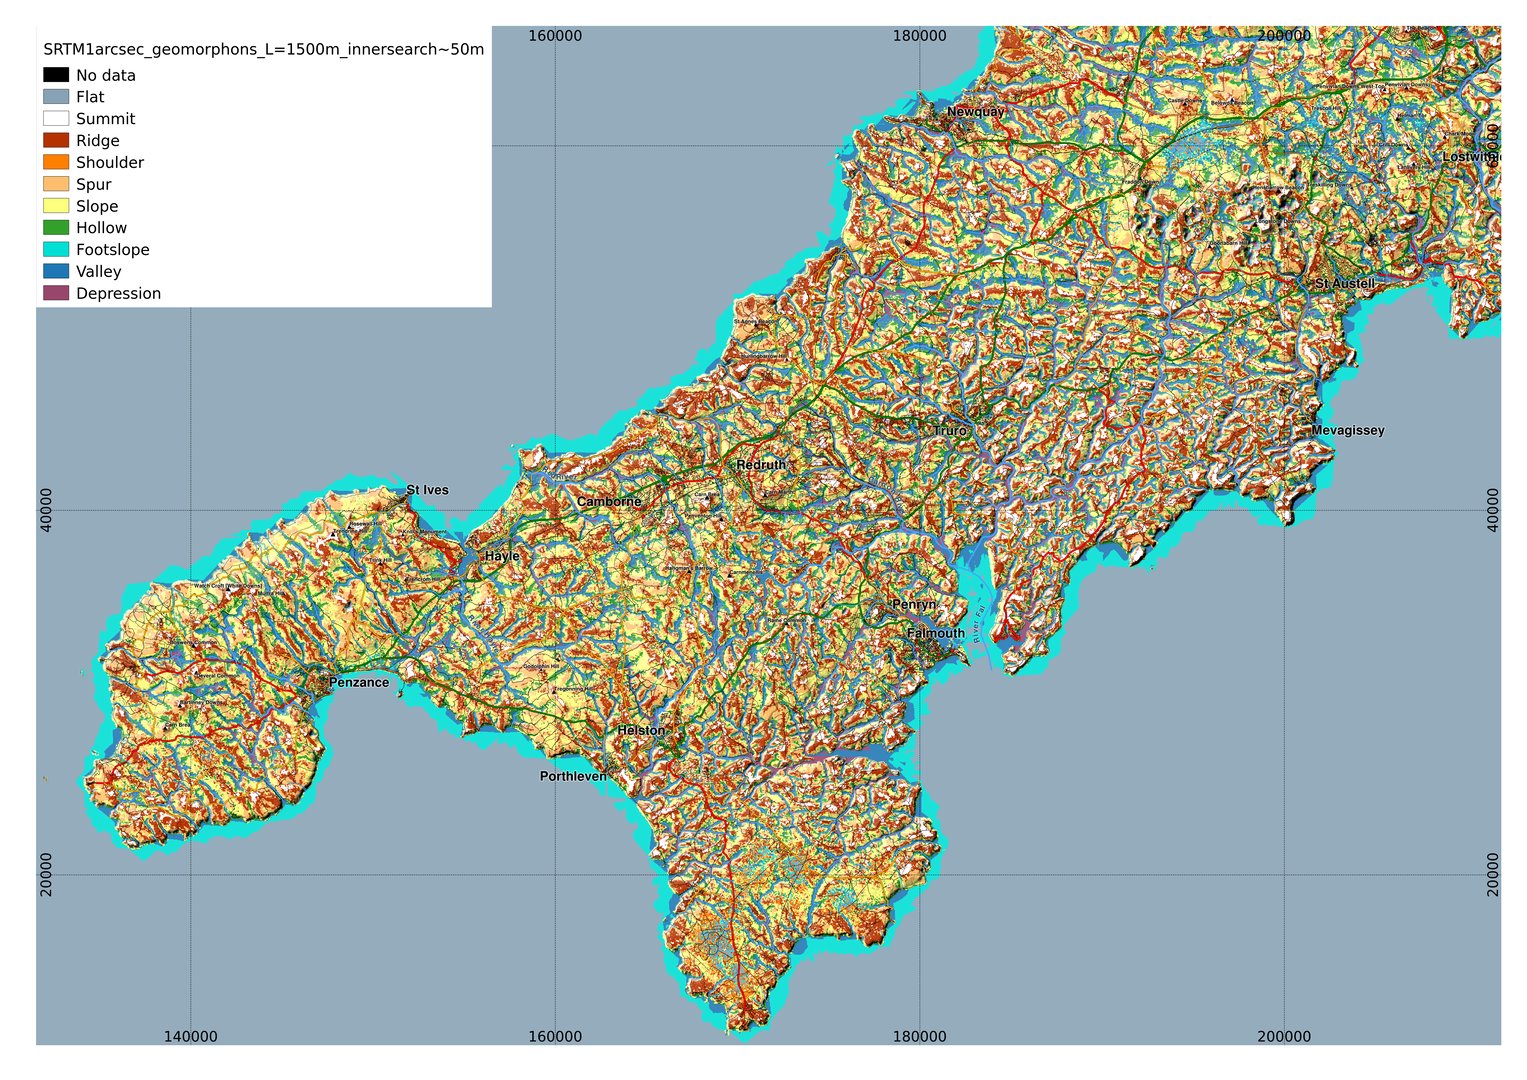 |
| West Cornwall. Full resolution image. |
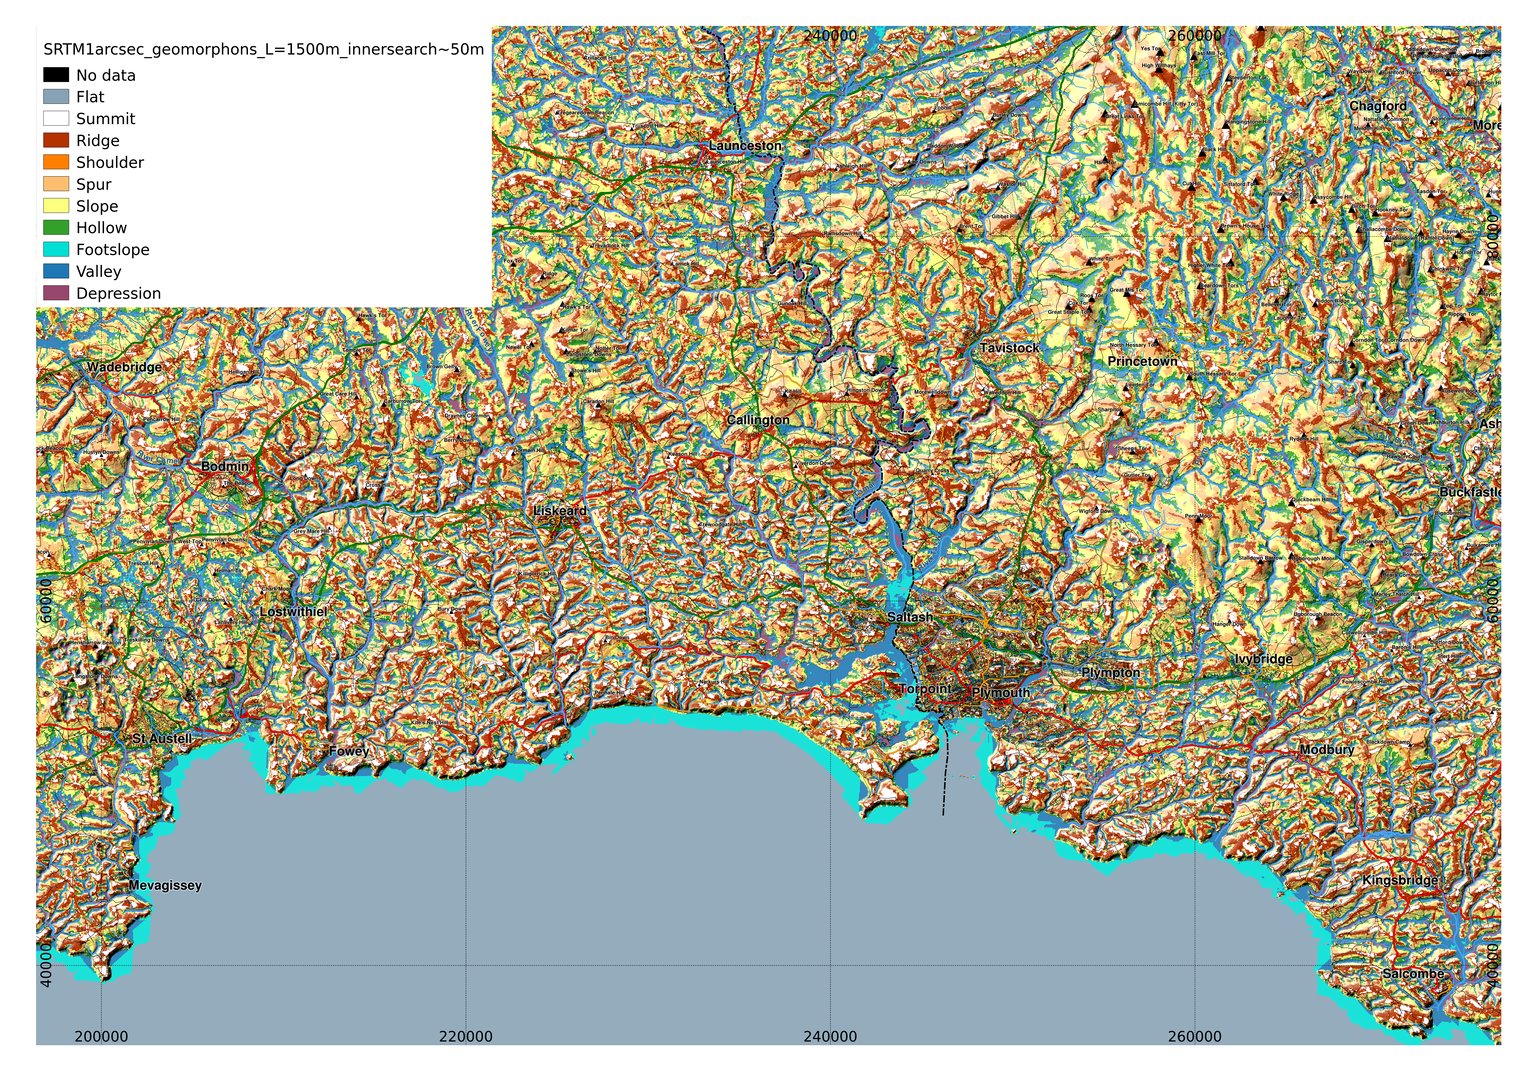 |
| SE Cornwall, Tamar valley and Dartmoor. Full-resolution image. |
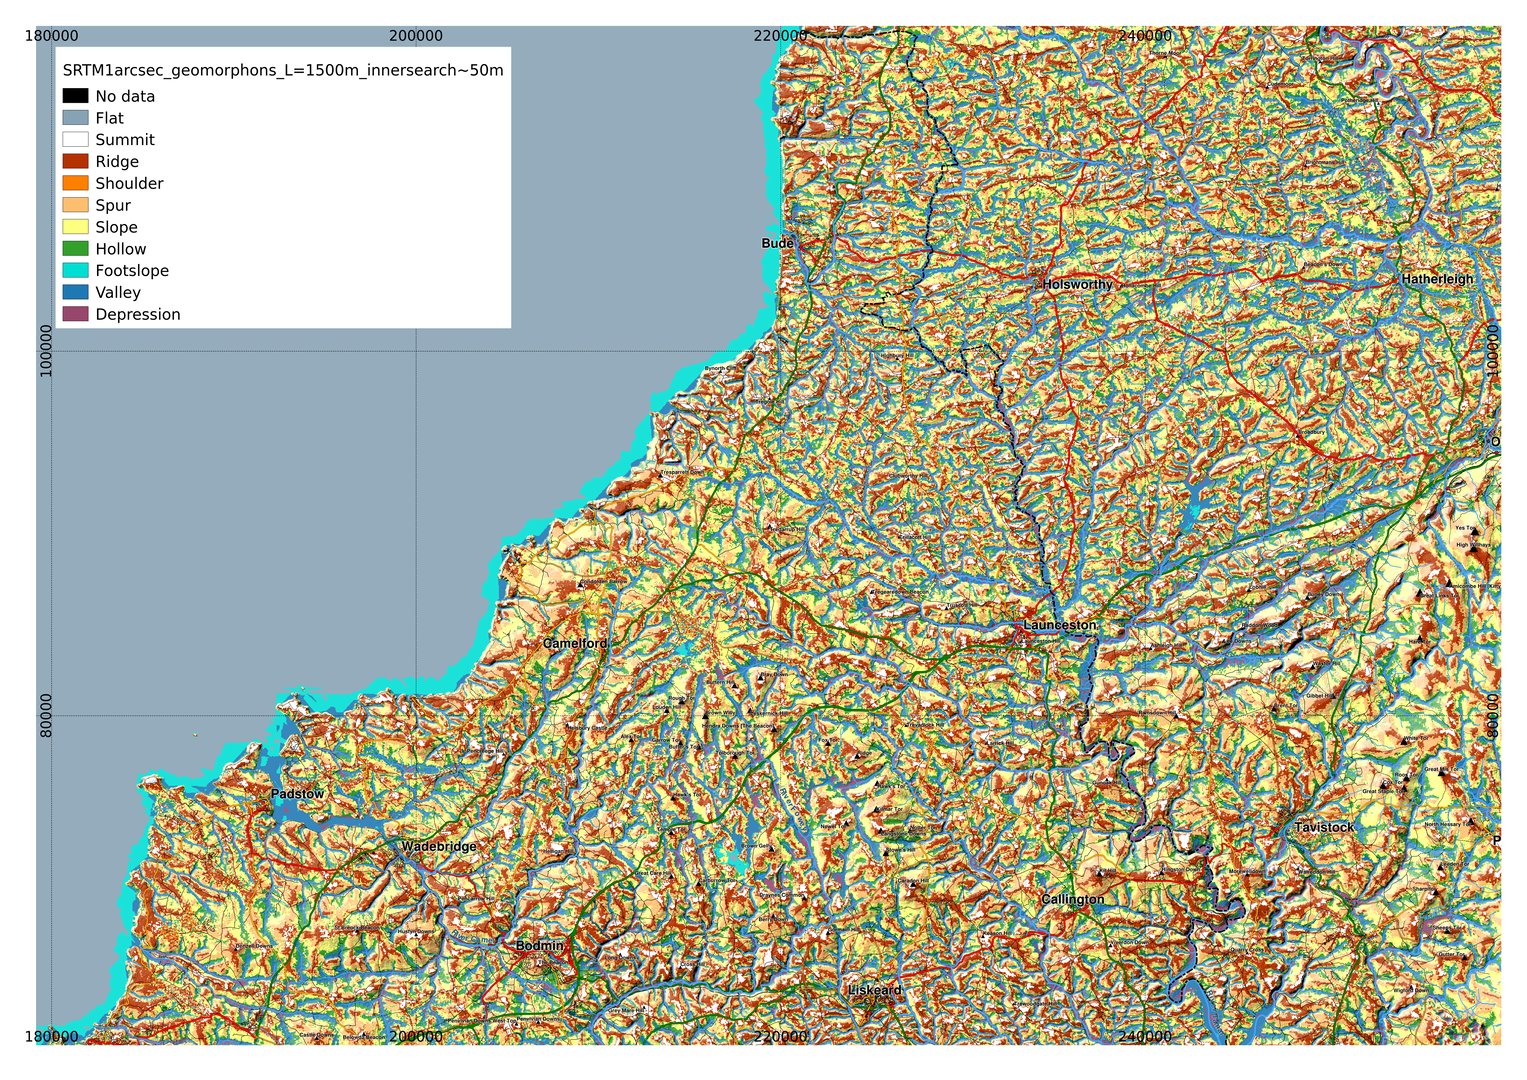 |
| North Cornwall. Full-resolution image. |
« Prev
1
2
3
4
5
6
7
8
9
10
11
12
13
14
15
16
17
18
19
20
21
22
23
24
25
26
27
28
29
30
31
32
33
34
35
36
37
38
39
40
41
42
43
44
45
46
47
Next »