Skrifennow
My blog, imported from Blogger and converted using Jekyll.
« Prev
1
2
3
4
5
6
7
8
9
10
11
12
13
14
15
16
17
18
19
20
21
22
23
24
25
26
27
28
29
30
31
32
33
34
35
36
37
38
39
40
41
42
43
44
45
46
47
Next »
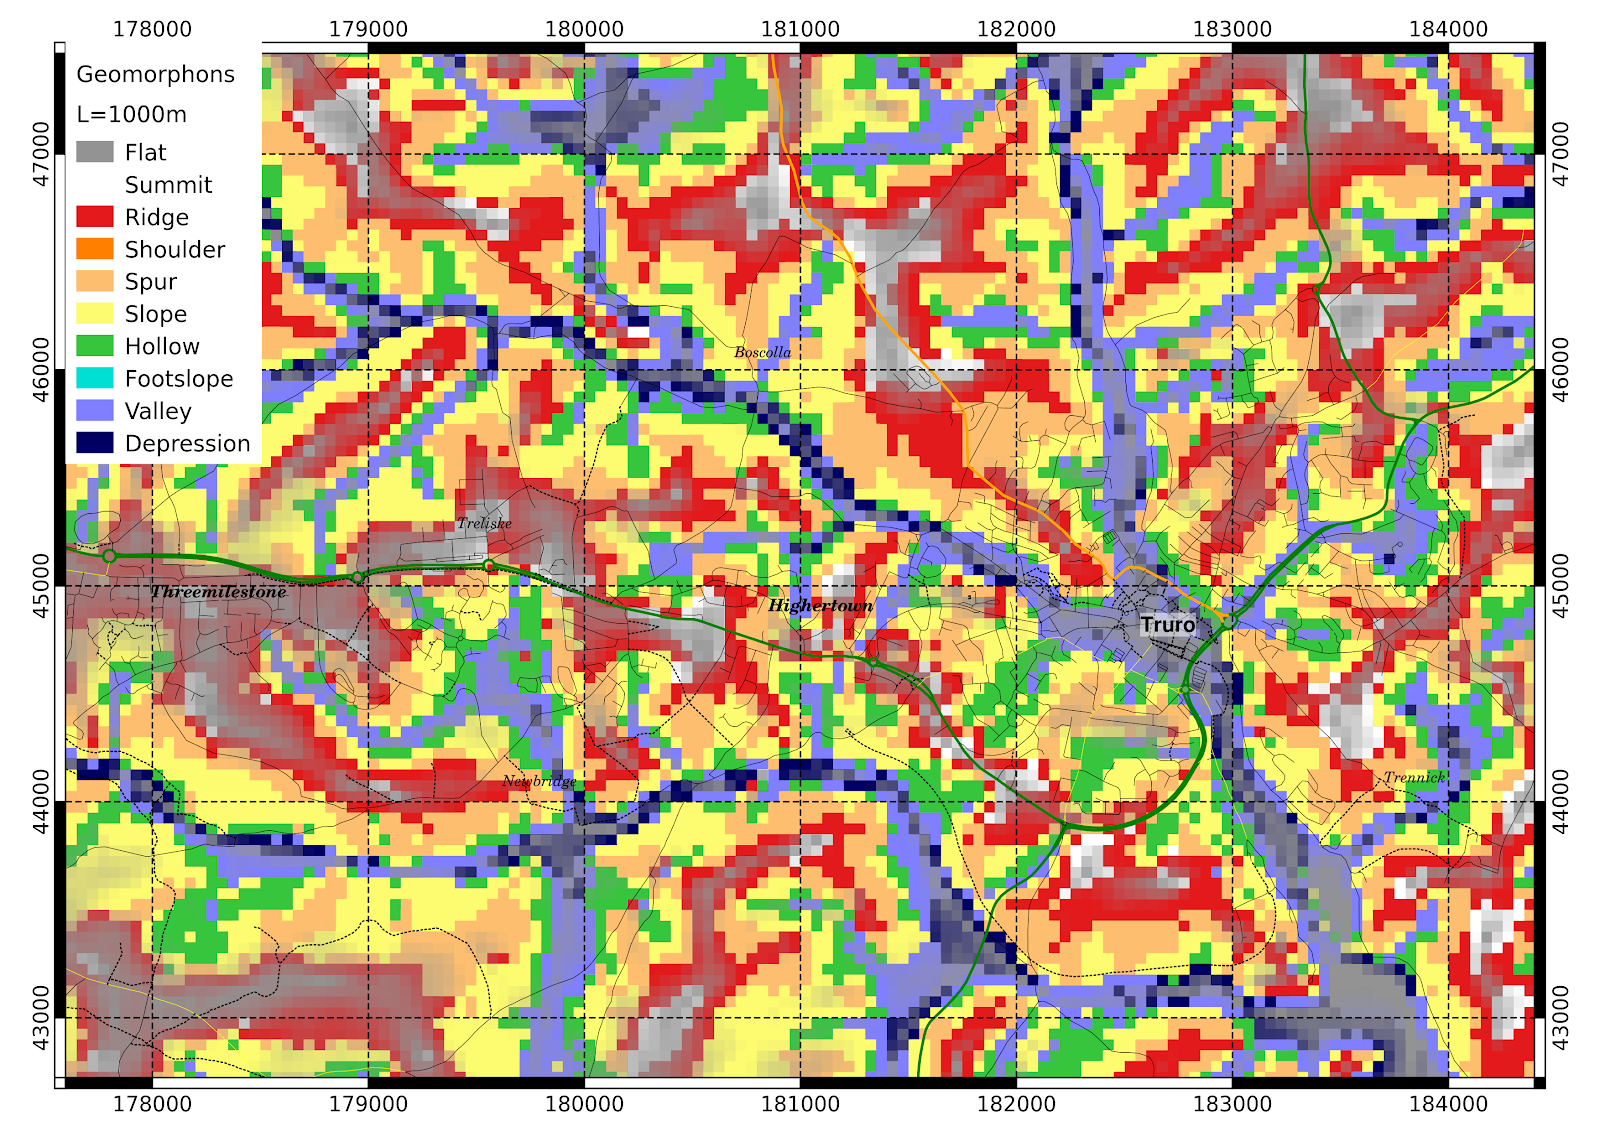
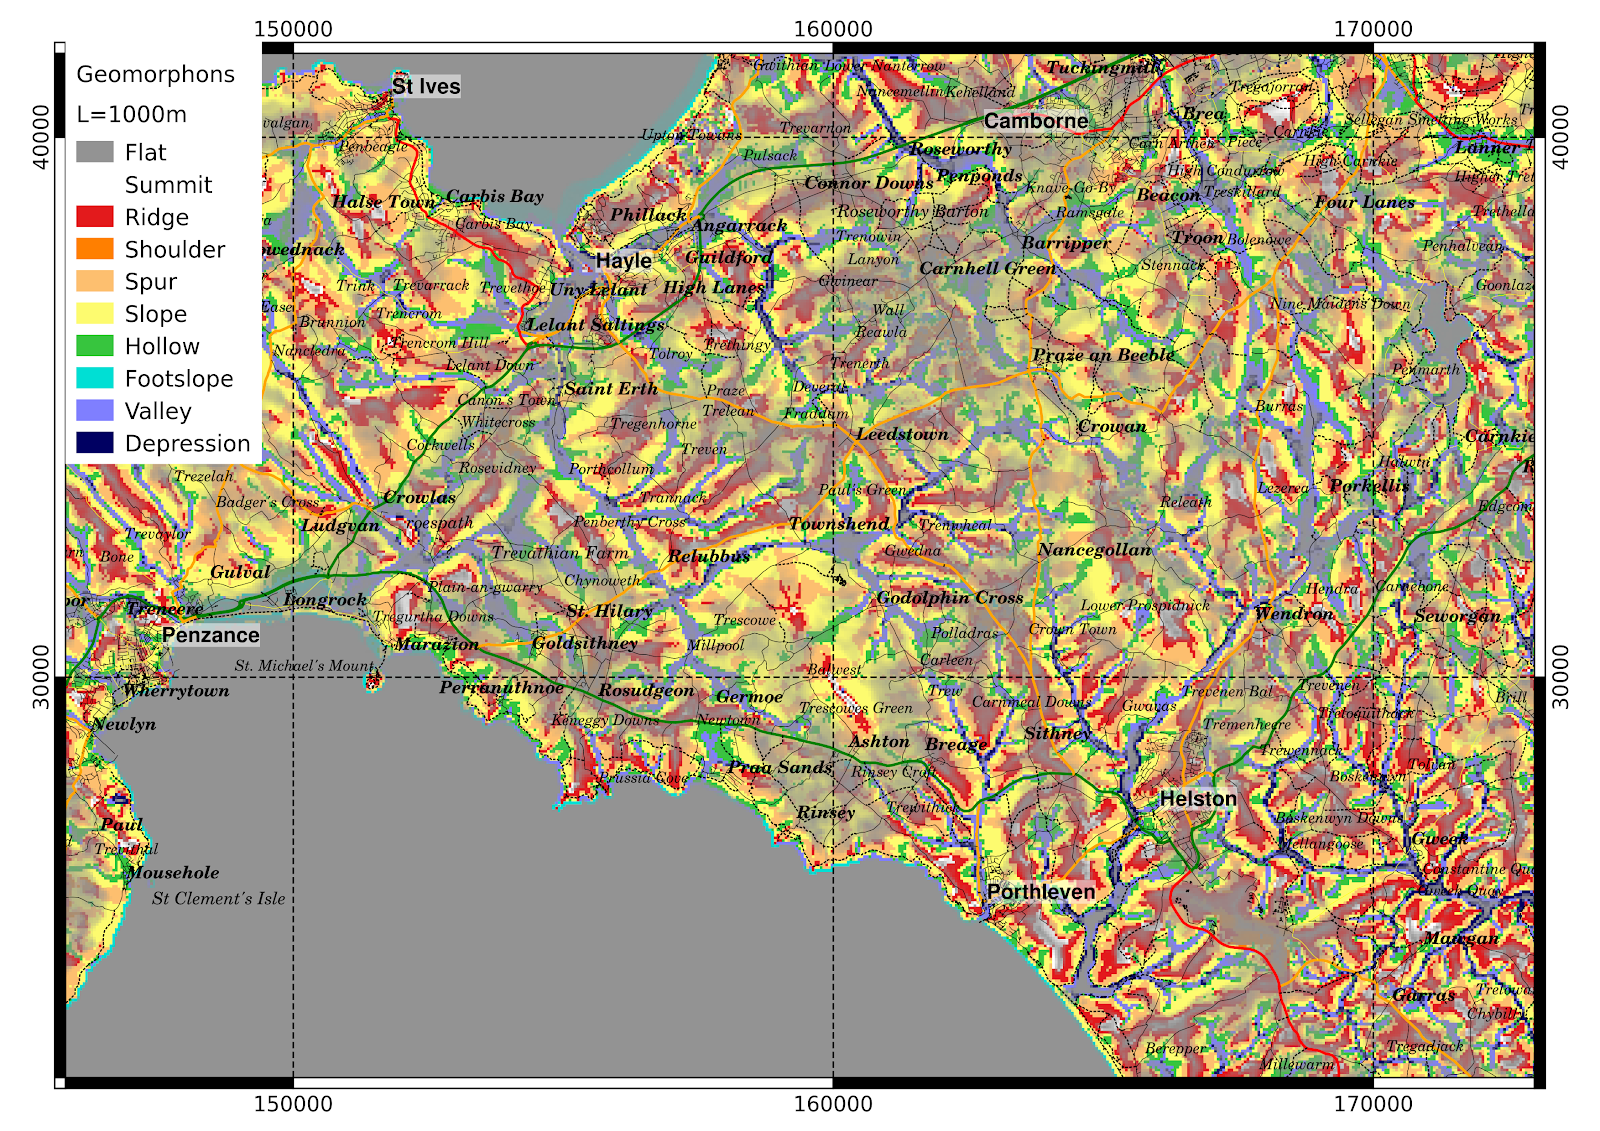
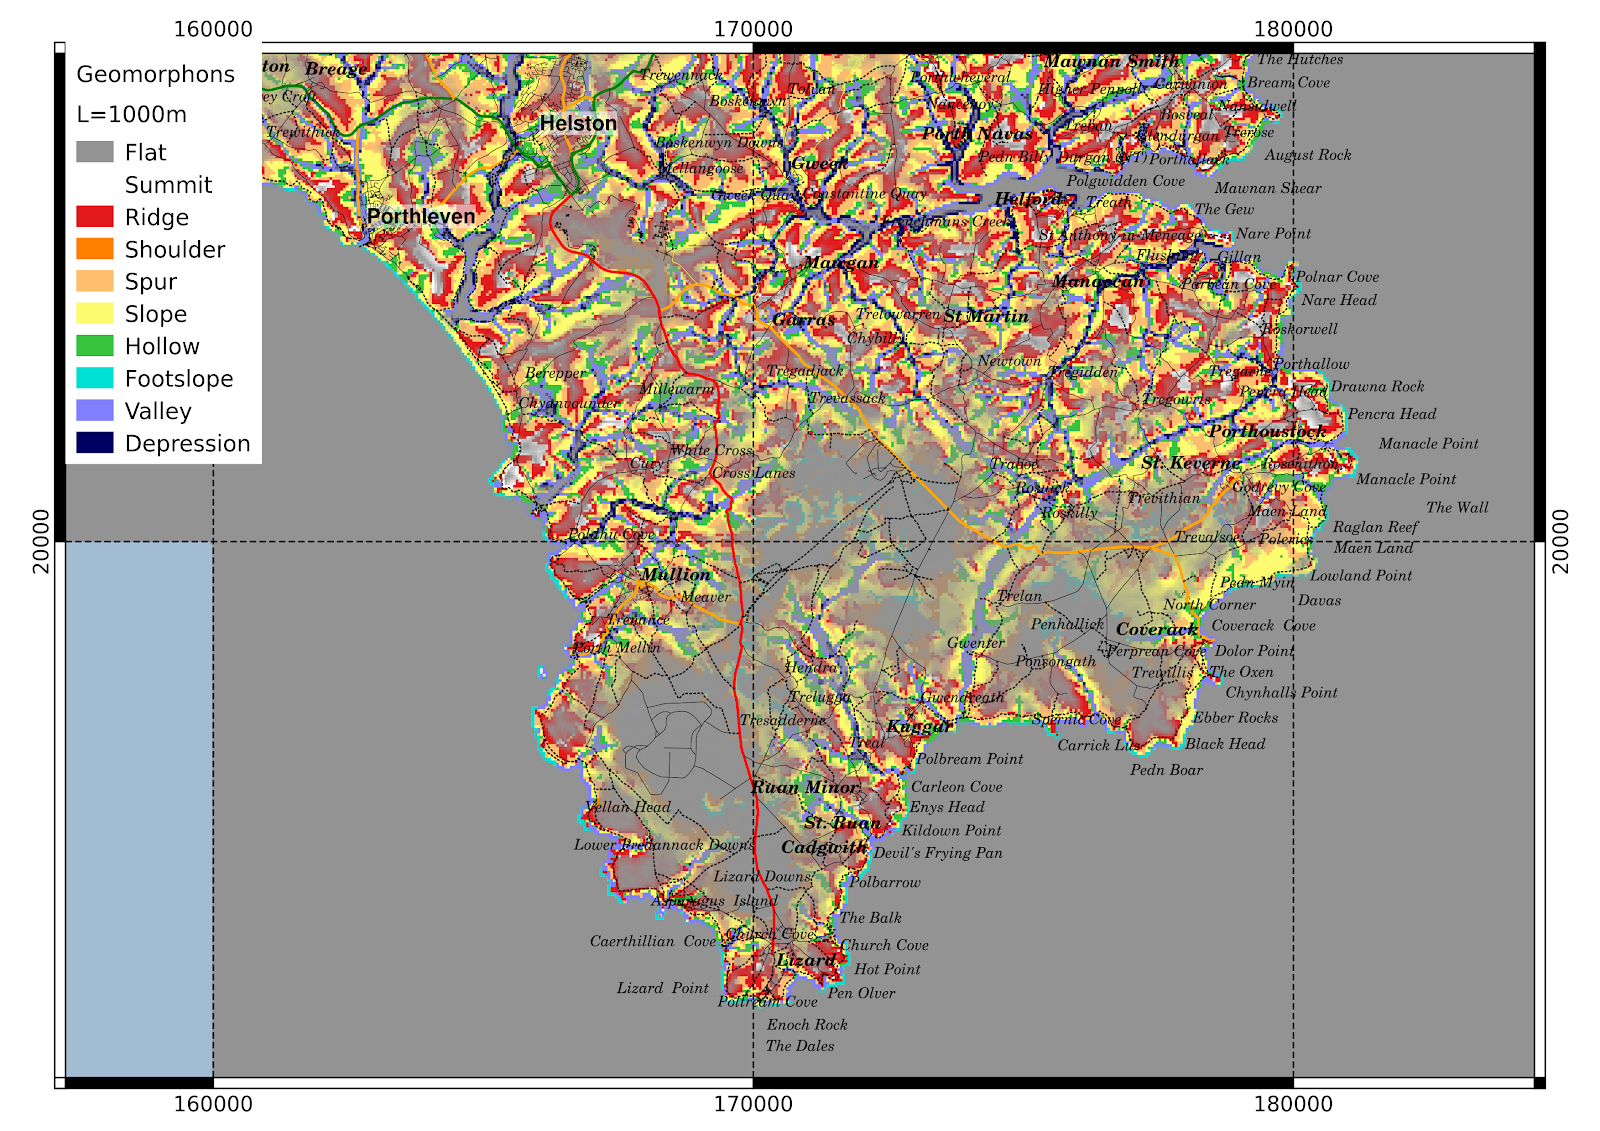
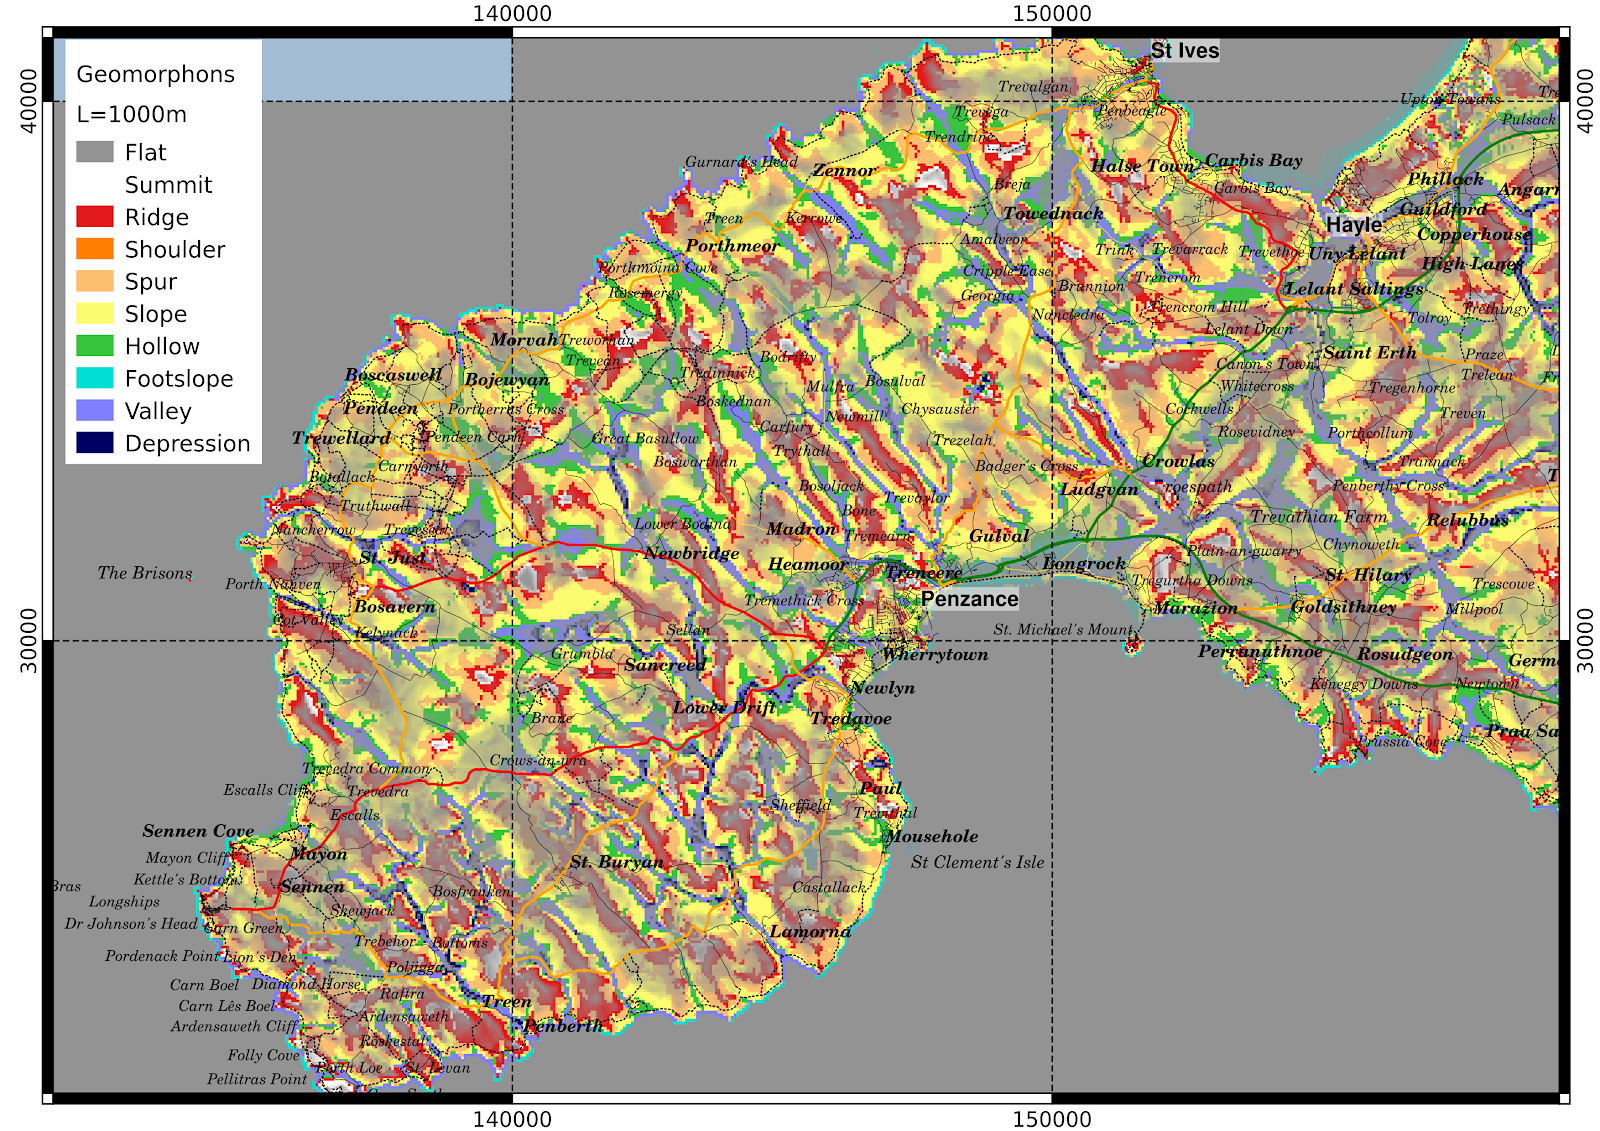
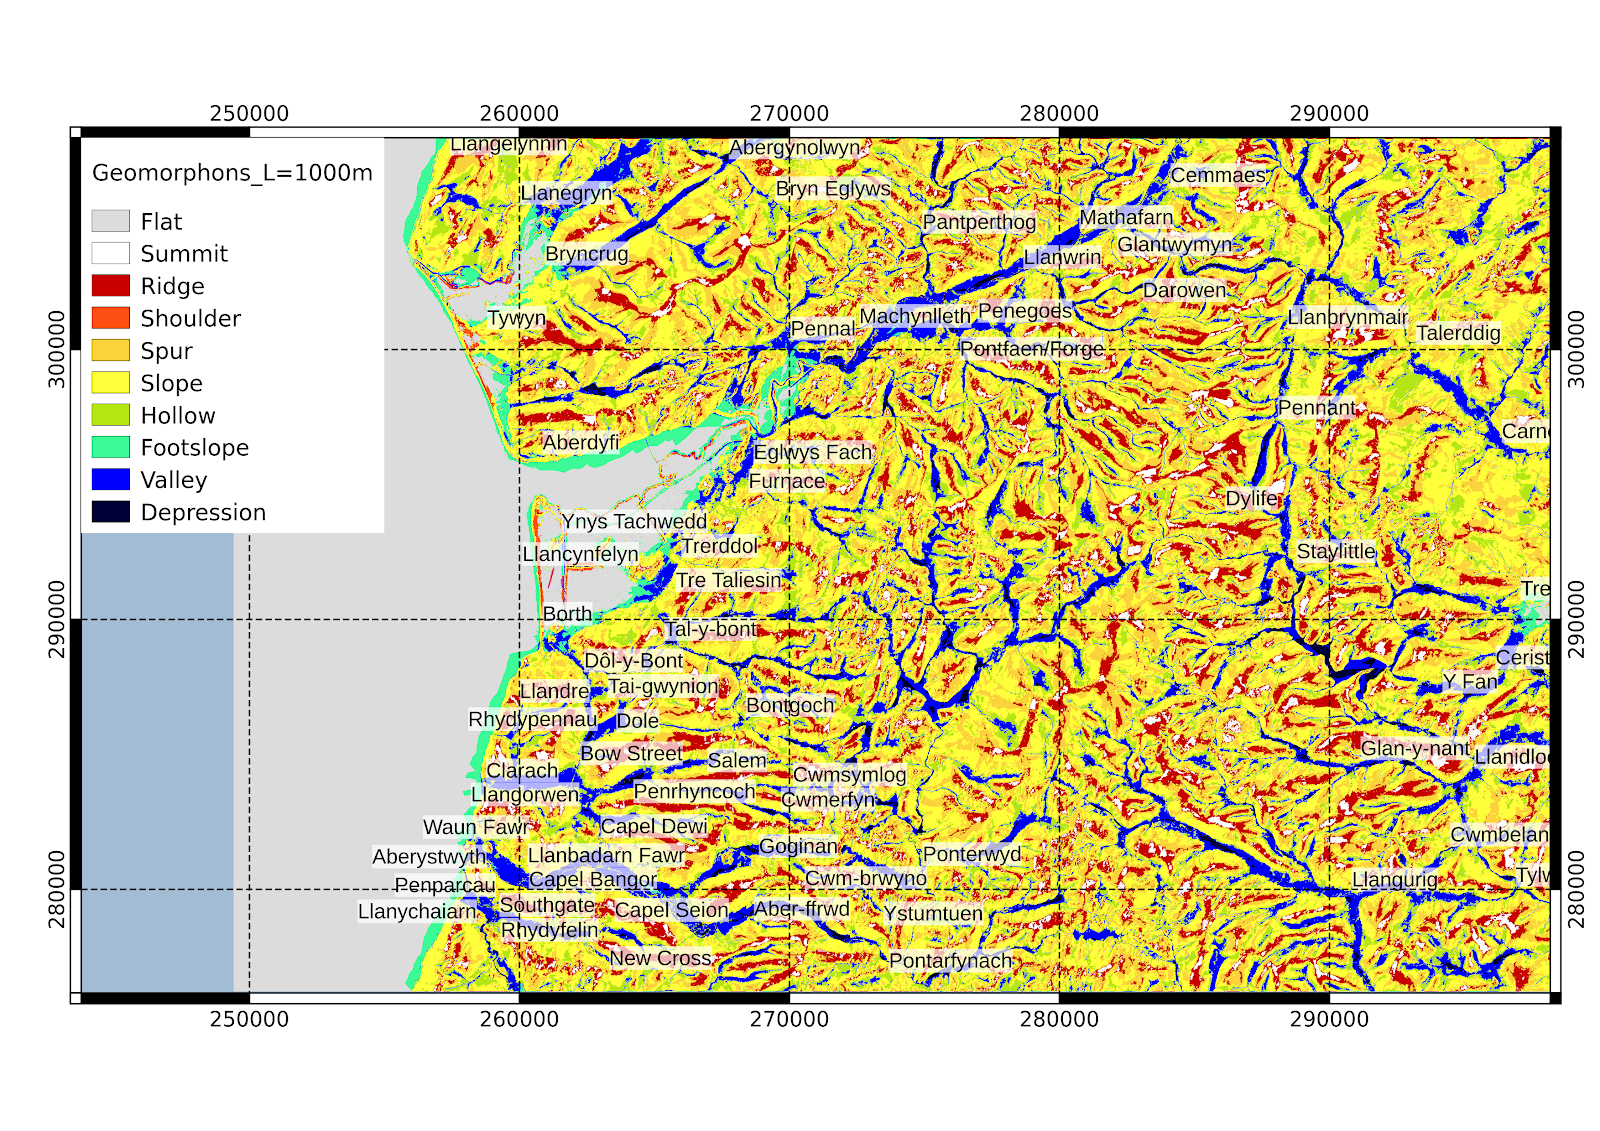
A few more geomorphon maps
One of the problems with the maps in my last post is that the vertical scale of the landforms is completely lost, it is impossible to tell whether a slope is shallow or steep.
A possible way to bring this information back is to grey out the shallowest slopes which I have done progressively for slopes less than 5 degrees in the maps below:


A possible way to bring this information back is to grey out the shallowest slopes which I have done progressively for slopes less than 5 degrees in the maps below:


Geomorphons - processing British Isles SRTM DEM with GRASS7 r.geomorphon extension
Some time ago I mentioned Geomorphons, a machine vision based approach to topographic analysis promoted by Stepinski and Jasiewicz.
If you don't know what a geomorphon is, here's a link to the Space Informatics Lab at University of Cinncinati, see also the papers: Stepinski+Jasiewicz 2011, Jasiewicz + Stepinski 2013
At the time I first came across this I had some trouble getting GRASS7 to install and get the extension working in Linux so I tried running GRASS7 in windows inside a VM but it didn't really work well.
Now however I have a working GRASS7 installation on Linux and here's a few demonstration maps, which show the broad categories of landscape position. Geomorphons use a line of sight approach best explained by the links and papers above.
I have used a search distance of L = 1000m in these maps, using Shuttle Radar Topography Mission data for the British Isles. I've set a threshold for flatness as 0.2 degrees, which is probably too small because in flat areas I'm not confident of the reality of these interpretations.
Geomorphons have a different kind of scale-dependence than the usual differential geometry based approaches used, though it is not independent of scale, it is more so than a simple slope analysis.
Co-ordinates are OSGB all-numeric throughout.
Changing the threshold for flatness to 1.0 degrees, flat areas such as Borth Bog are shown as such on the map.
If you don't know what a geomorphon is, here's a link to the Space Informatics Lab at University of Cinncinati, see also the papers: Stepinski+Jasiewicz 2011, Jasiewicz + Stepinski 2013
At the time I first came across this I had some trouble getting GRASS7 to install and get the extension working in Linux so I tried running GRASS7 in windows inside a VM but it didn't really work well.
Now however I have a working GRASS7 installation on Linux and here's a few demonstration maps, which show the broad categories of landscape position. Geomorphons use a line of sight approach best explained by the links and papers above.
I have used a search distance of L = 1000m in these maps, using Shuttle Radar Topography Mission data for the British Isles. I've set a threshold for flatness as 0.2 degrees, which is probably too small because in flat areas I'm not confident of the reality of these interpretations.
Geomorphons have a different kind of scale-dependence than the usual differential geometry based approaches used, though it is not independent of scale, it is more so than a simple slope analysis.
Co-ordinates are OSGB all-numeric throughout.
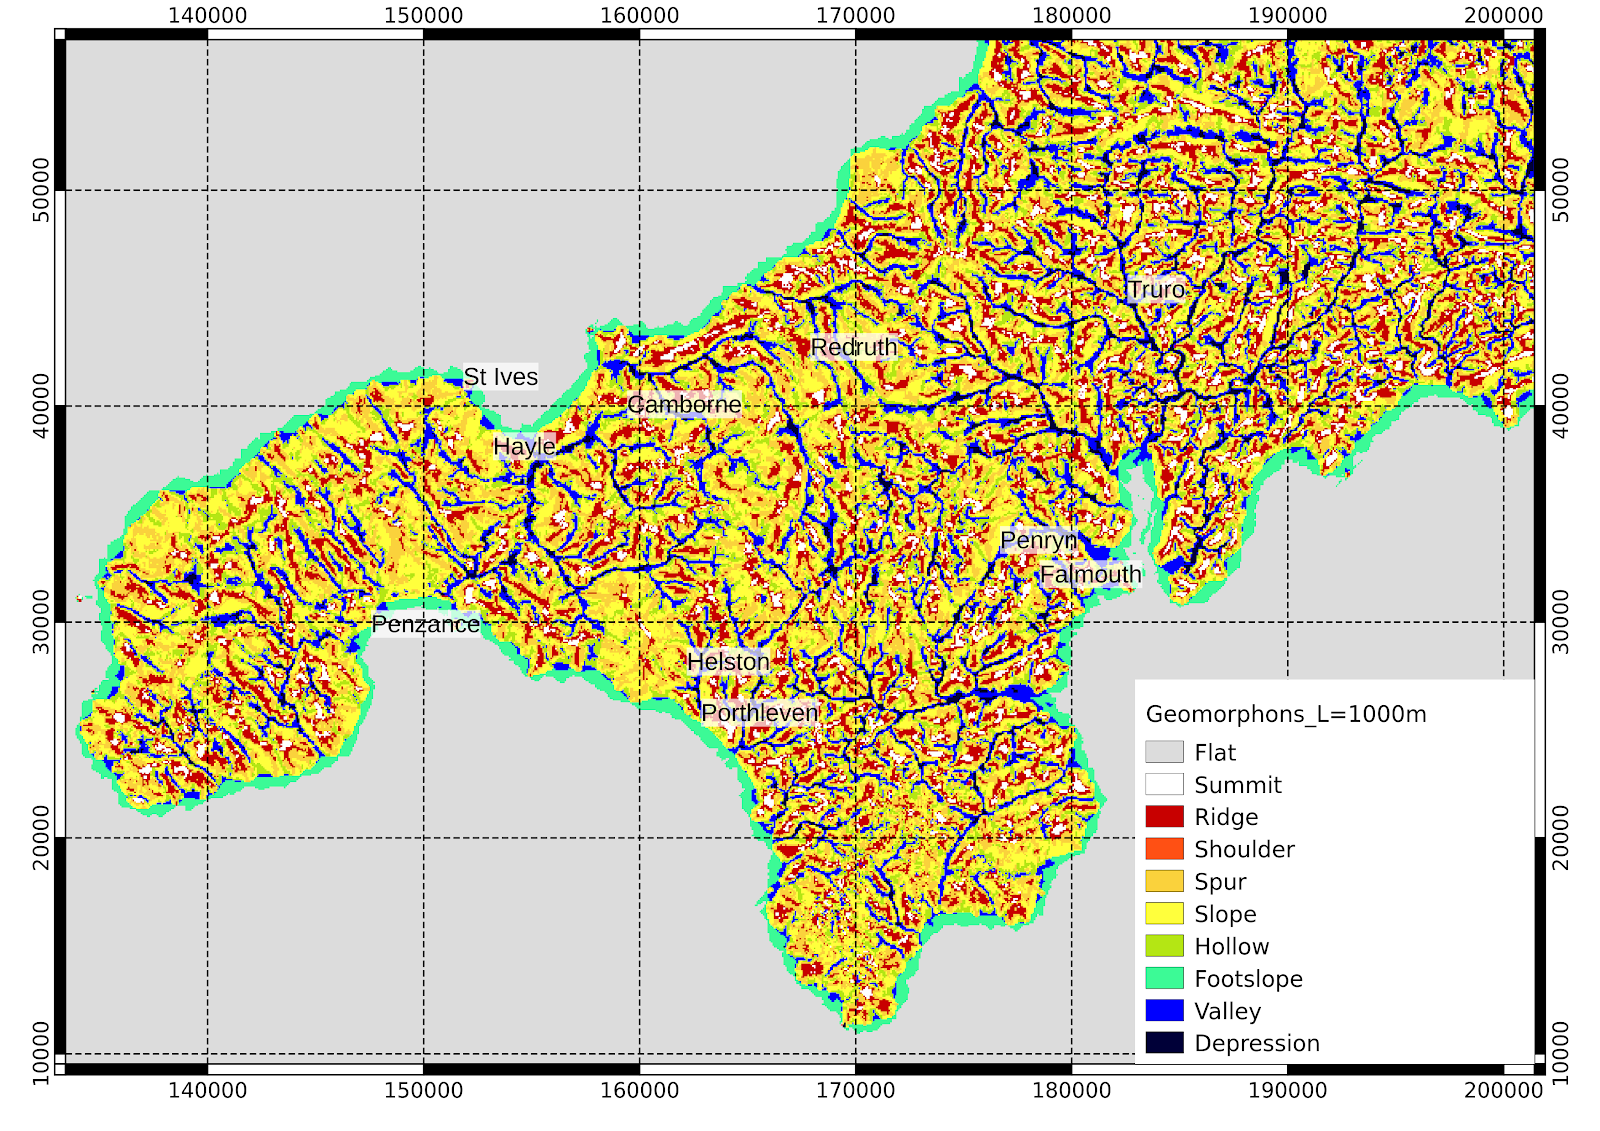 |
| West Cornwall |
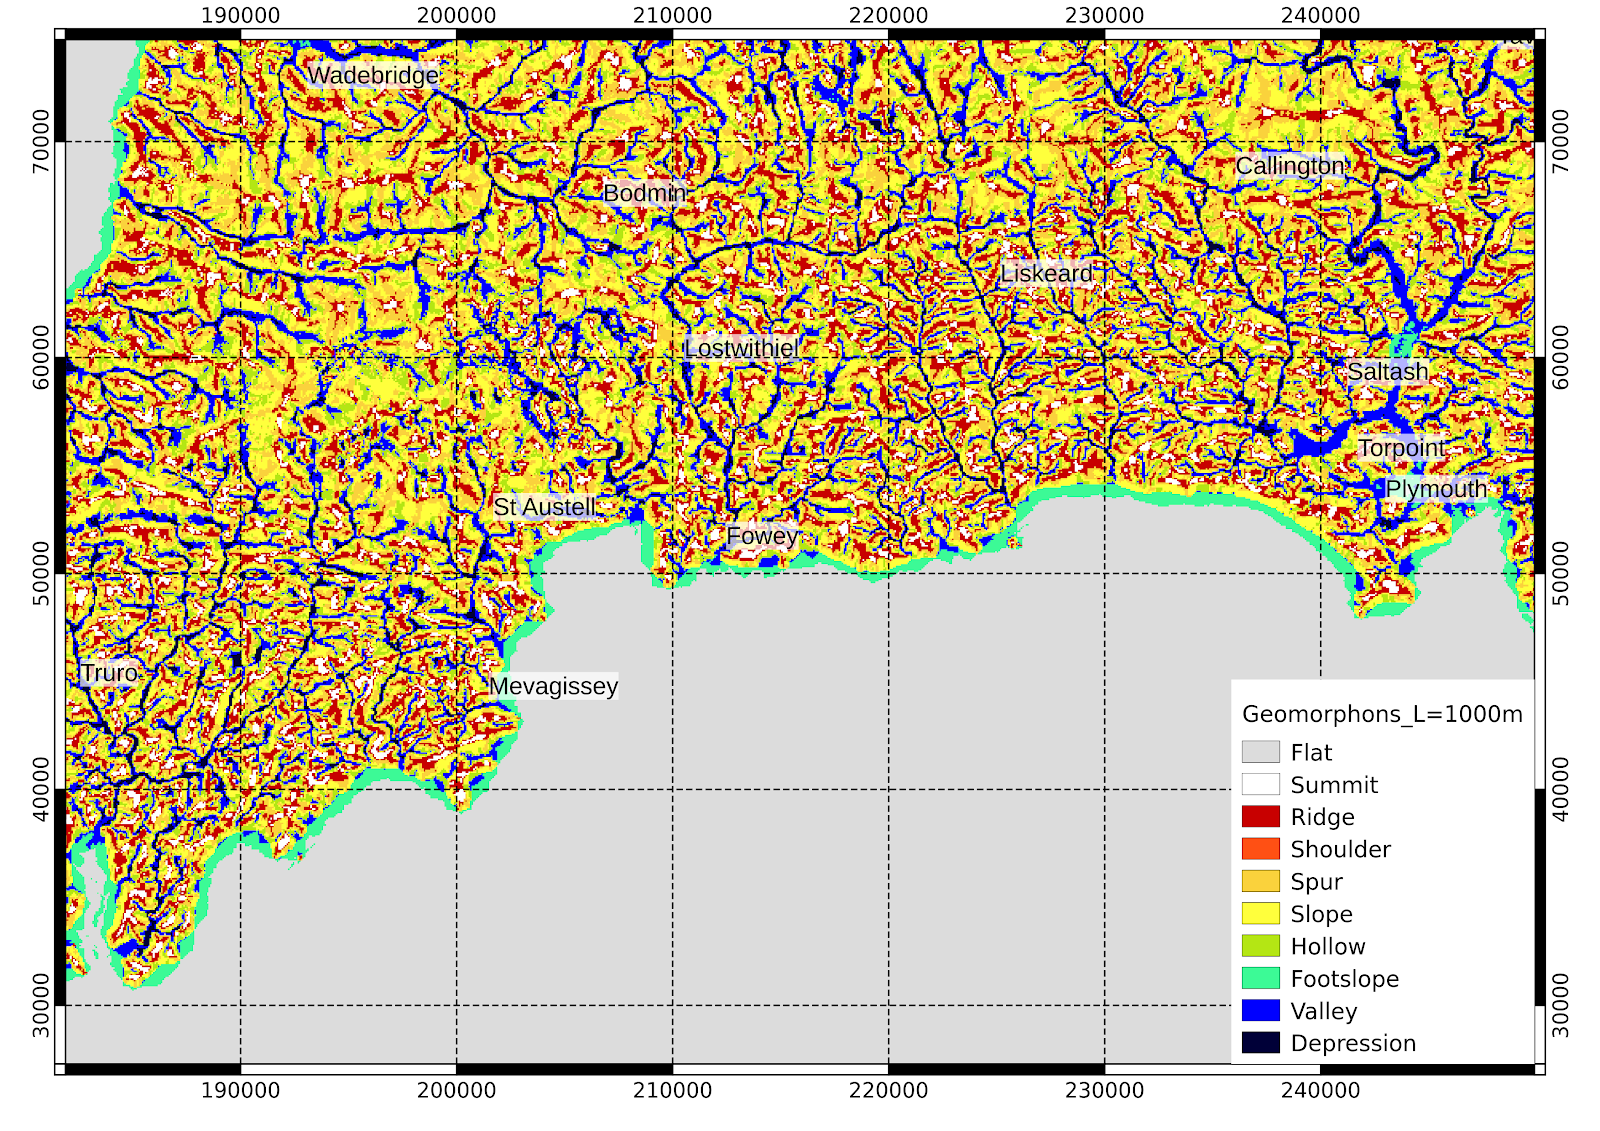 |
| SE Cornwall |
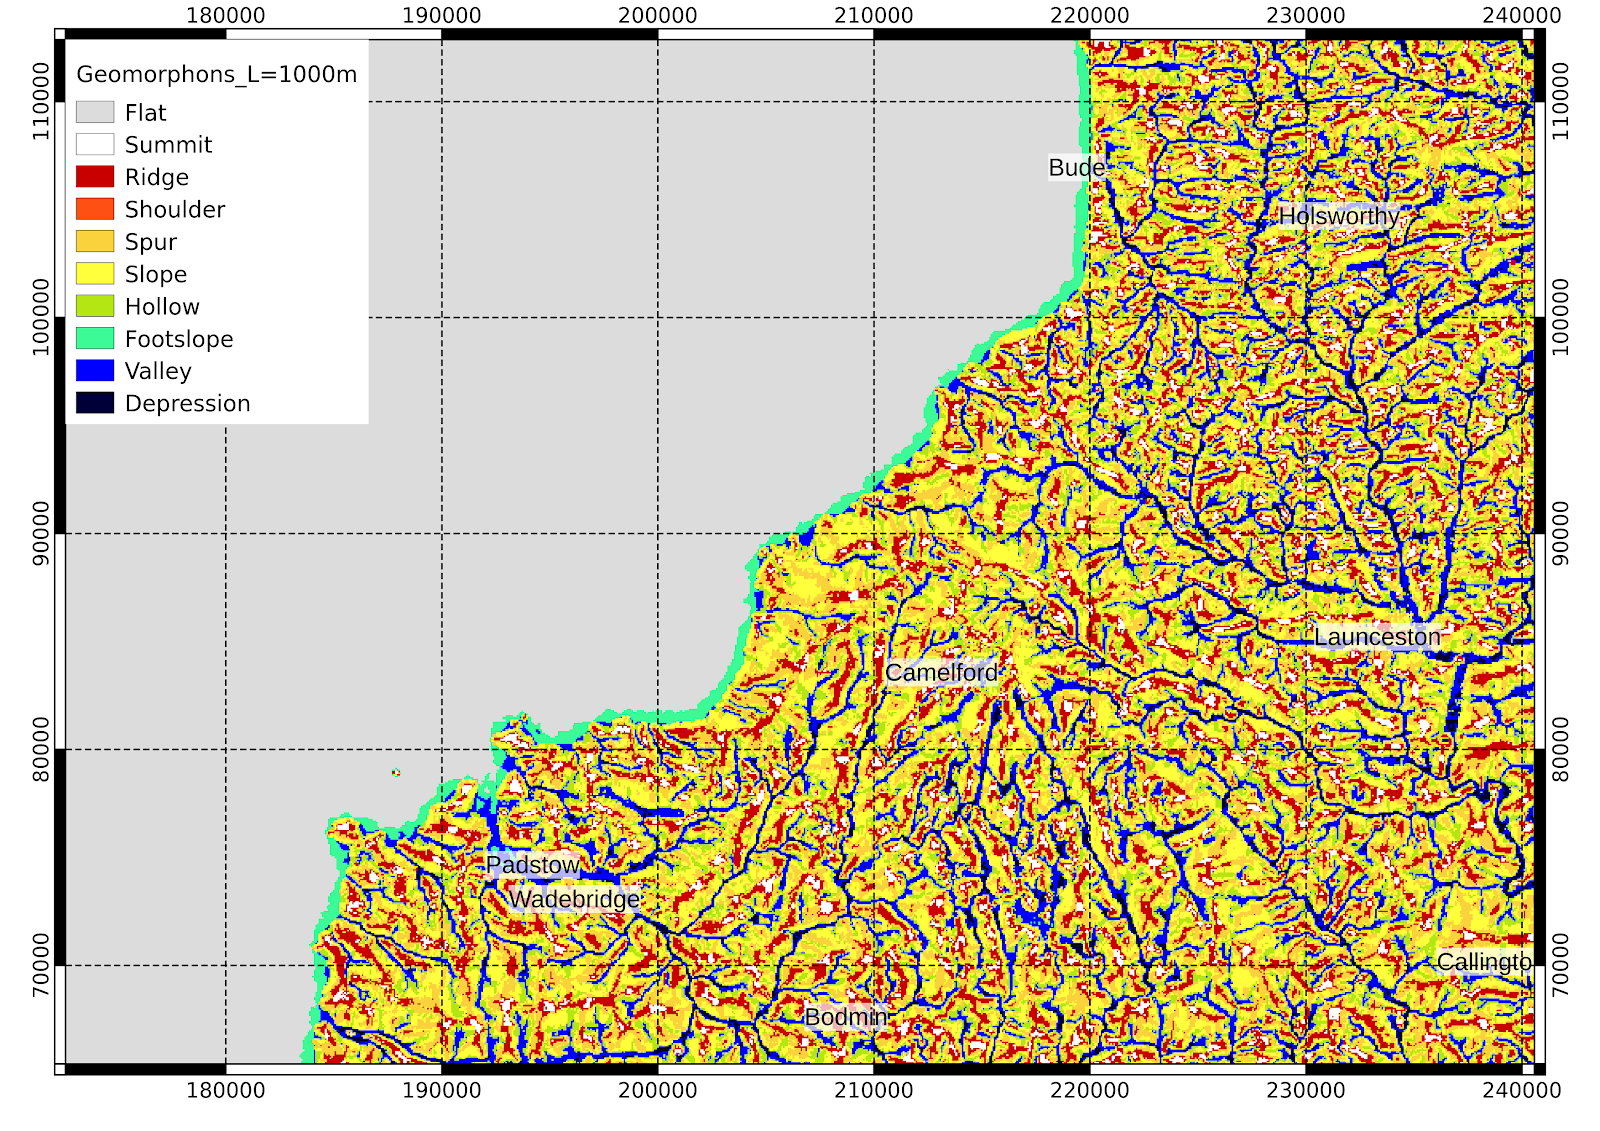 |
| N Cornwall |
 | |||||||||
| Aberystwyth area in mid-Wales |
 |
| Mid-wales the same as above but with flatness threshold of 1 degree |
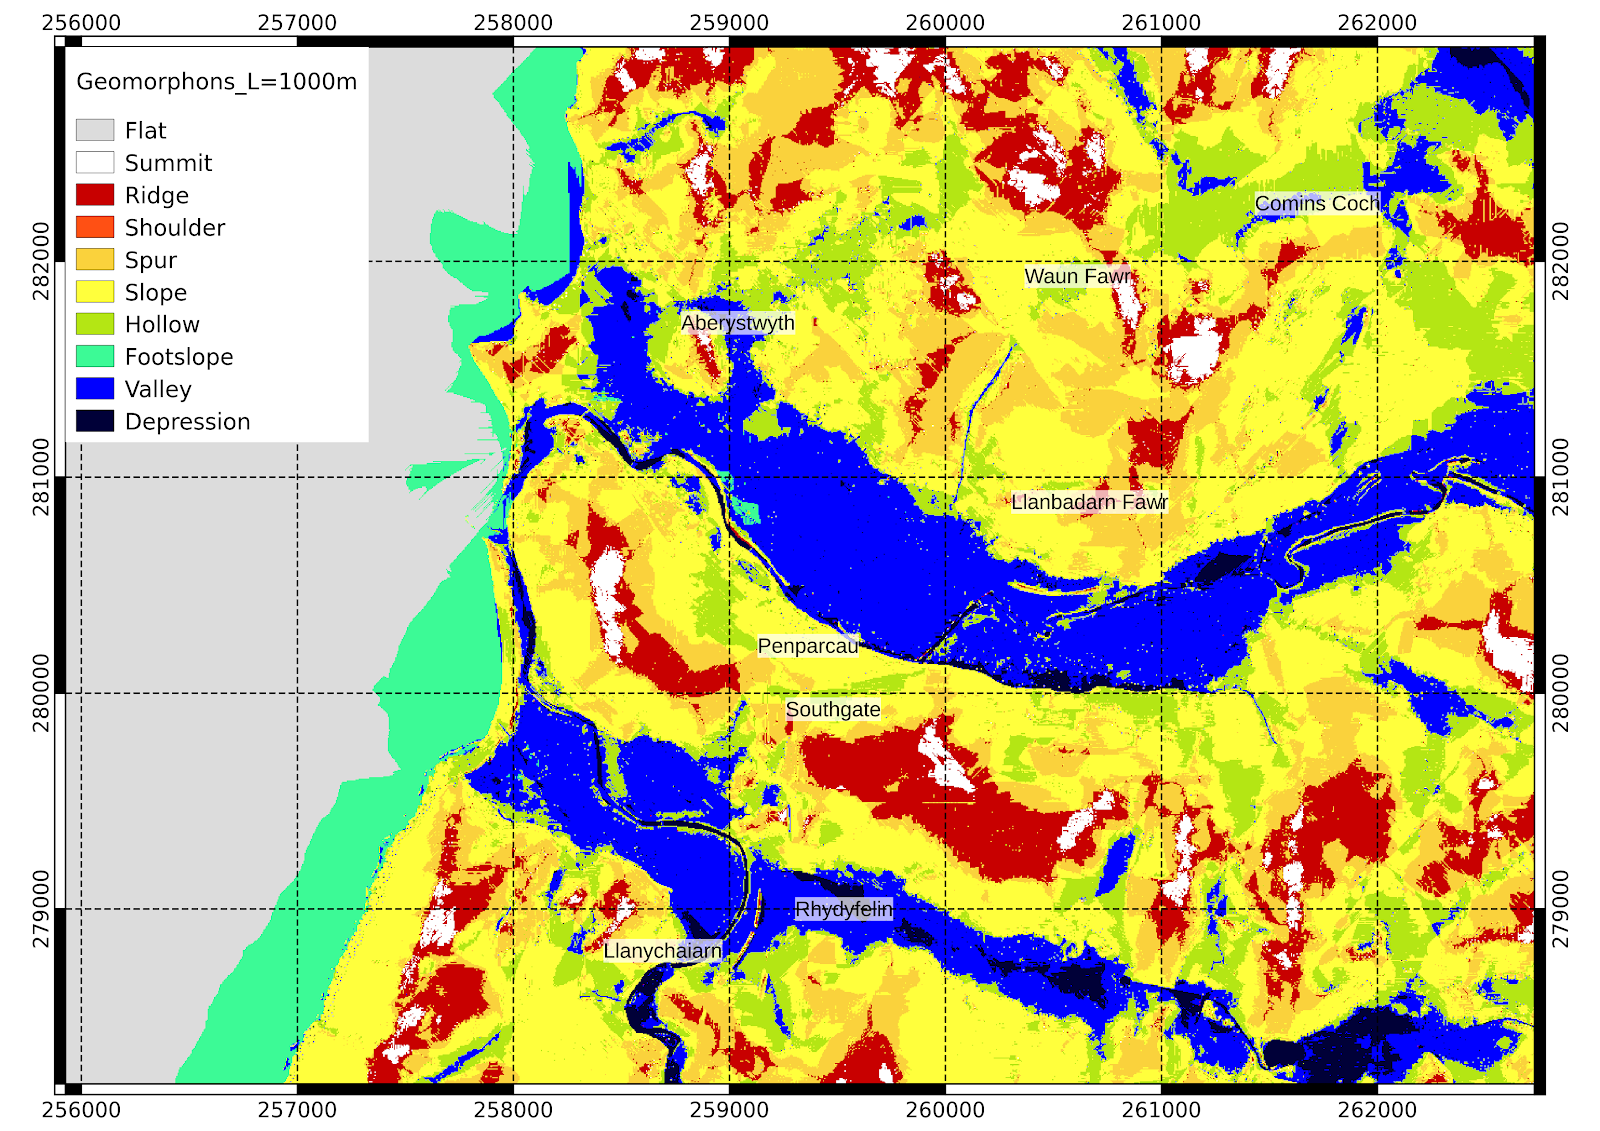
A closeup with 5m data:
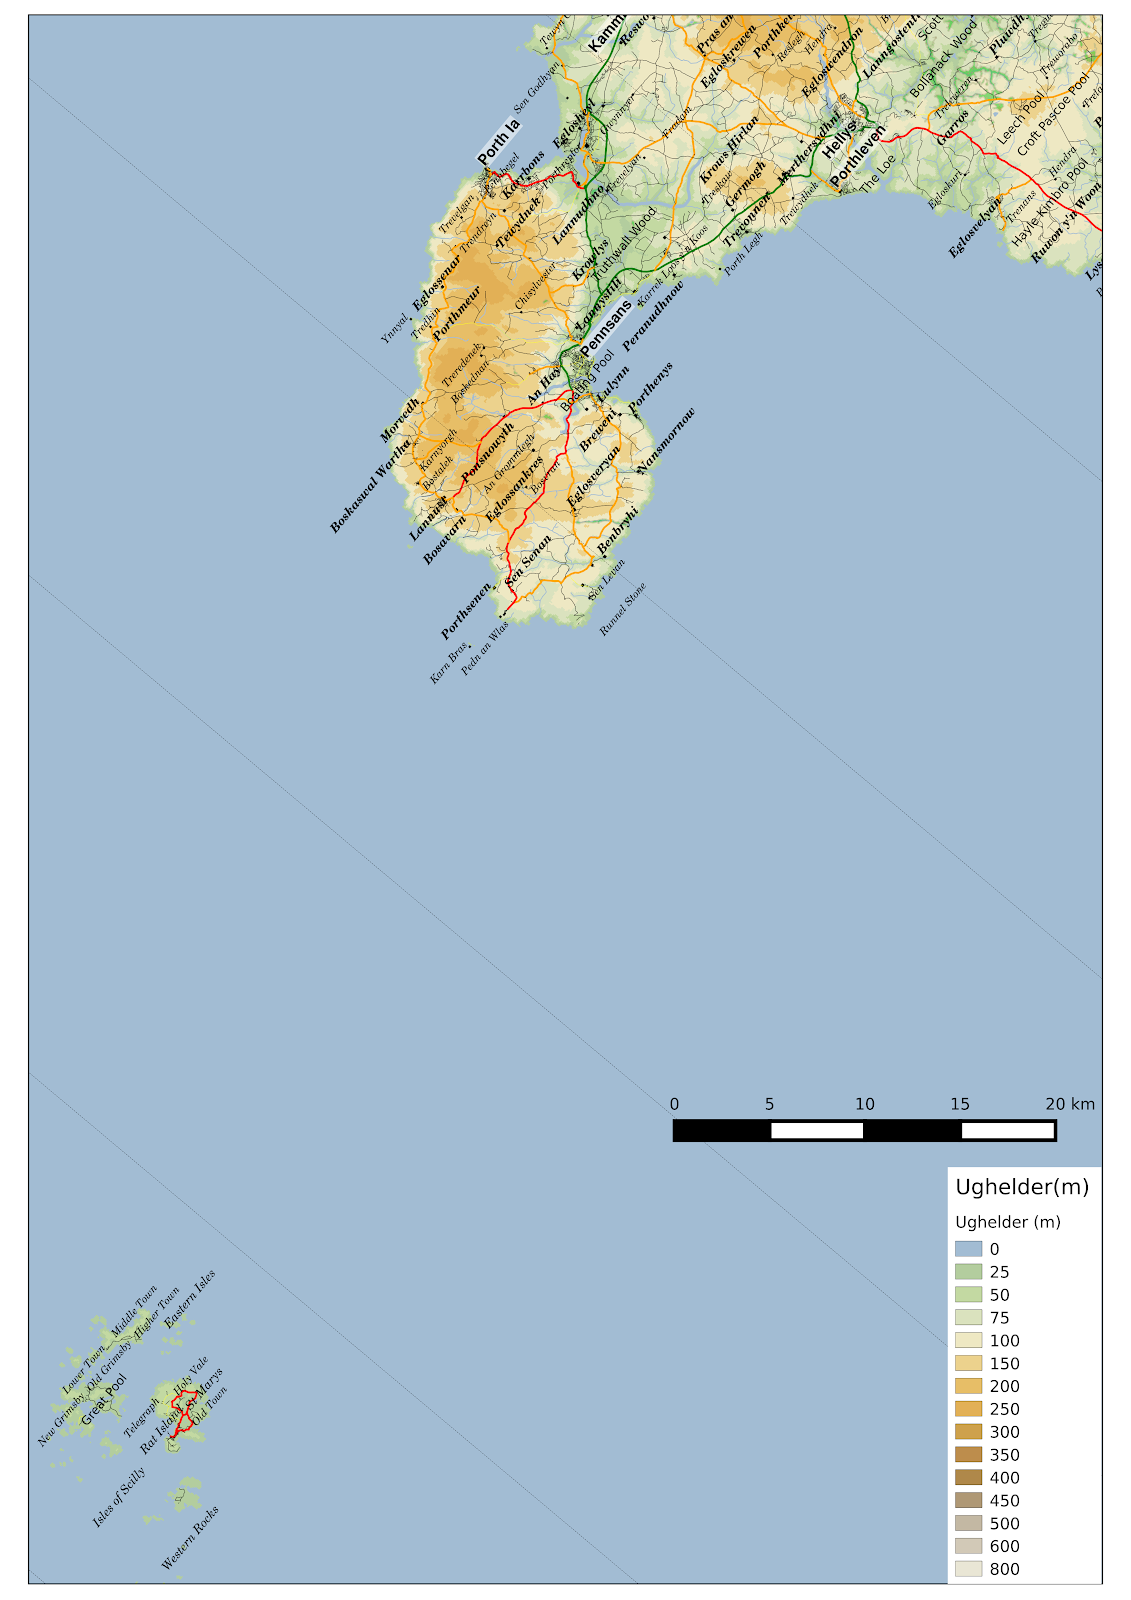
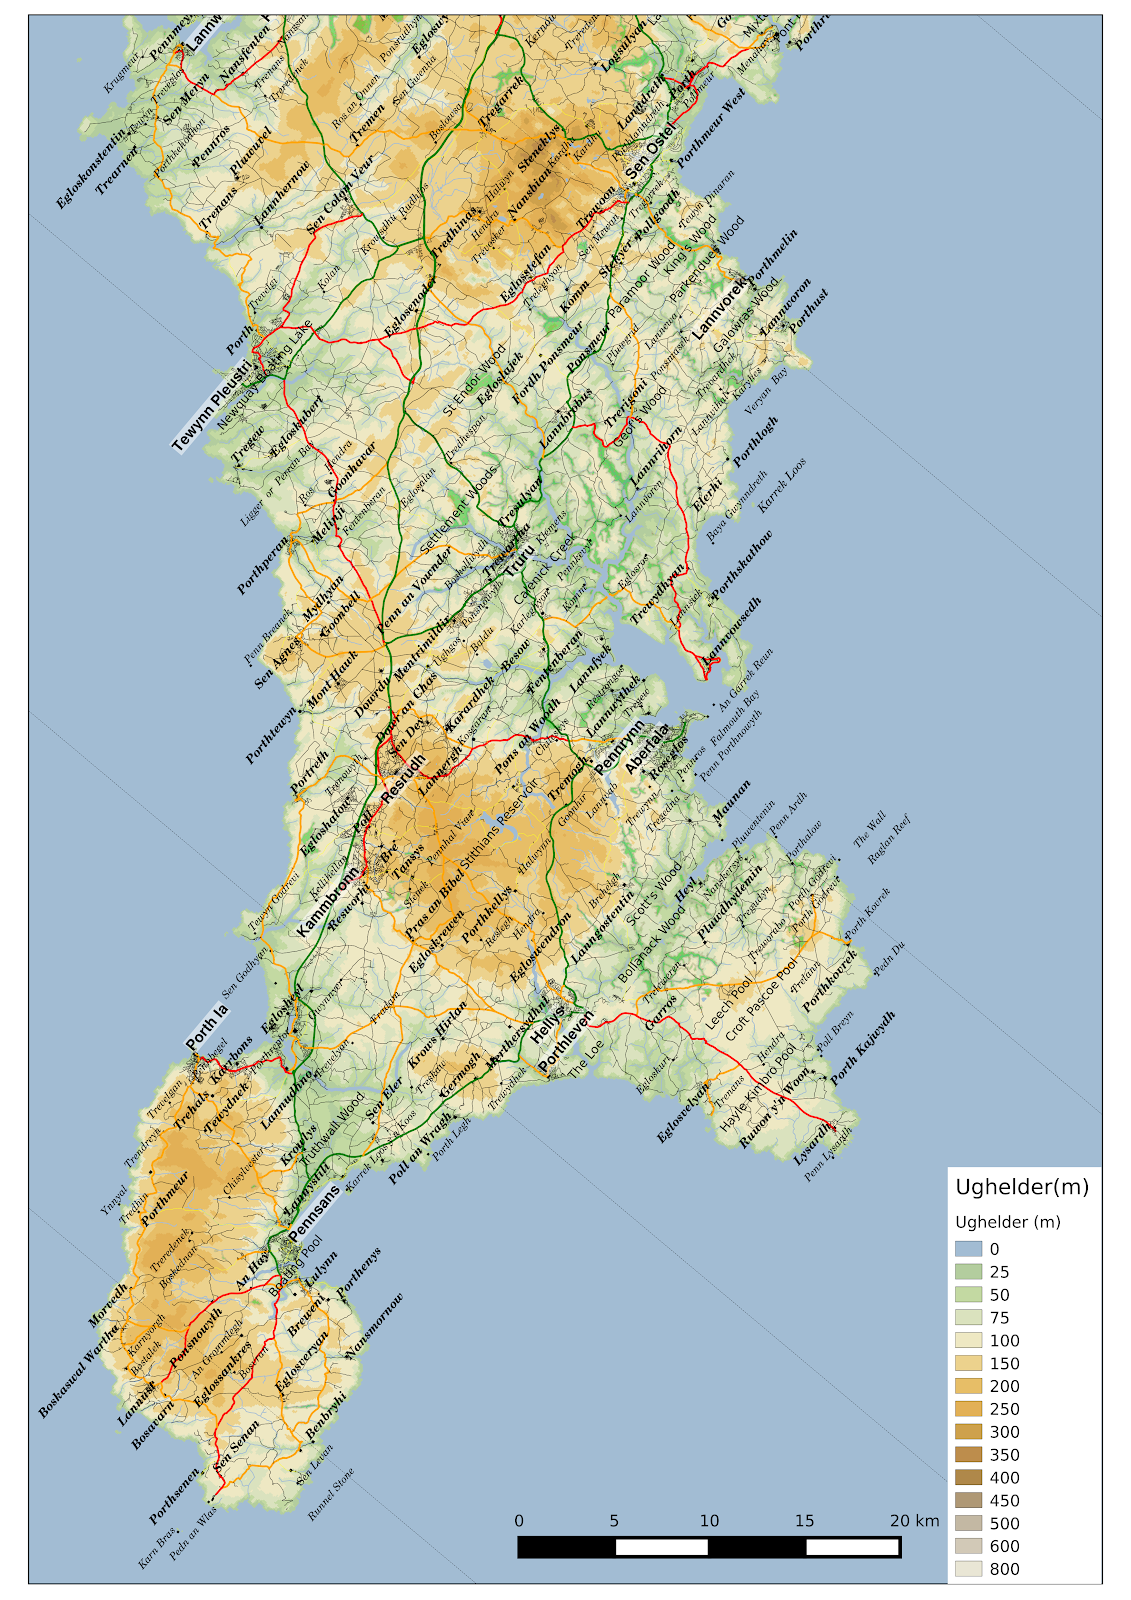
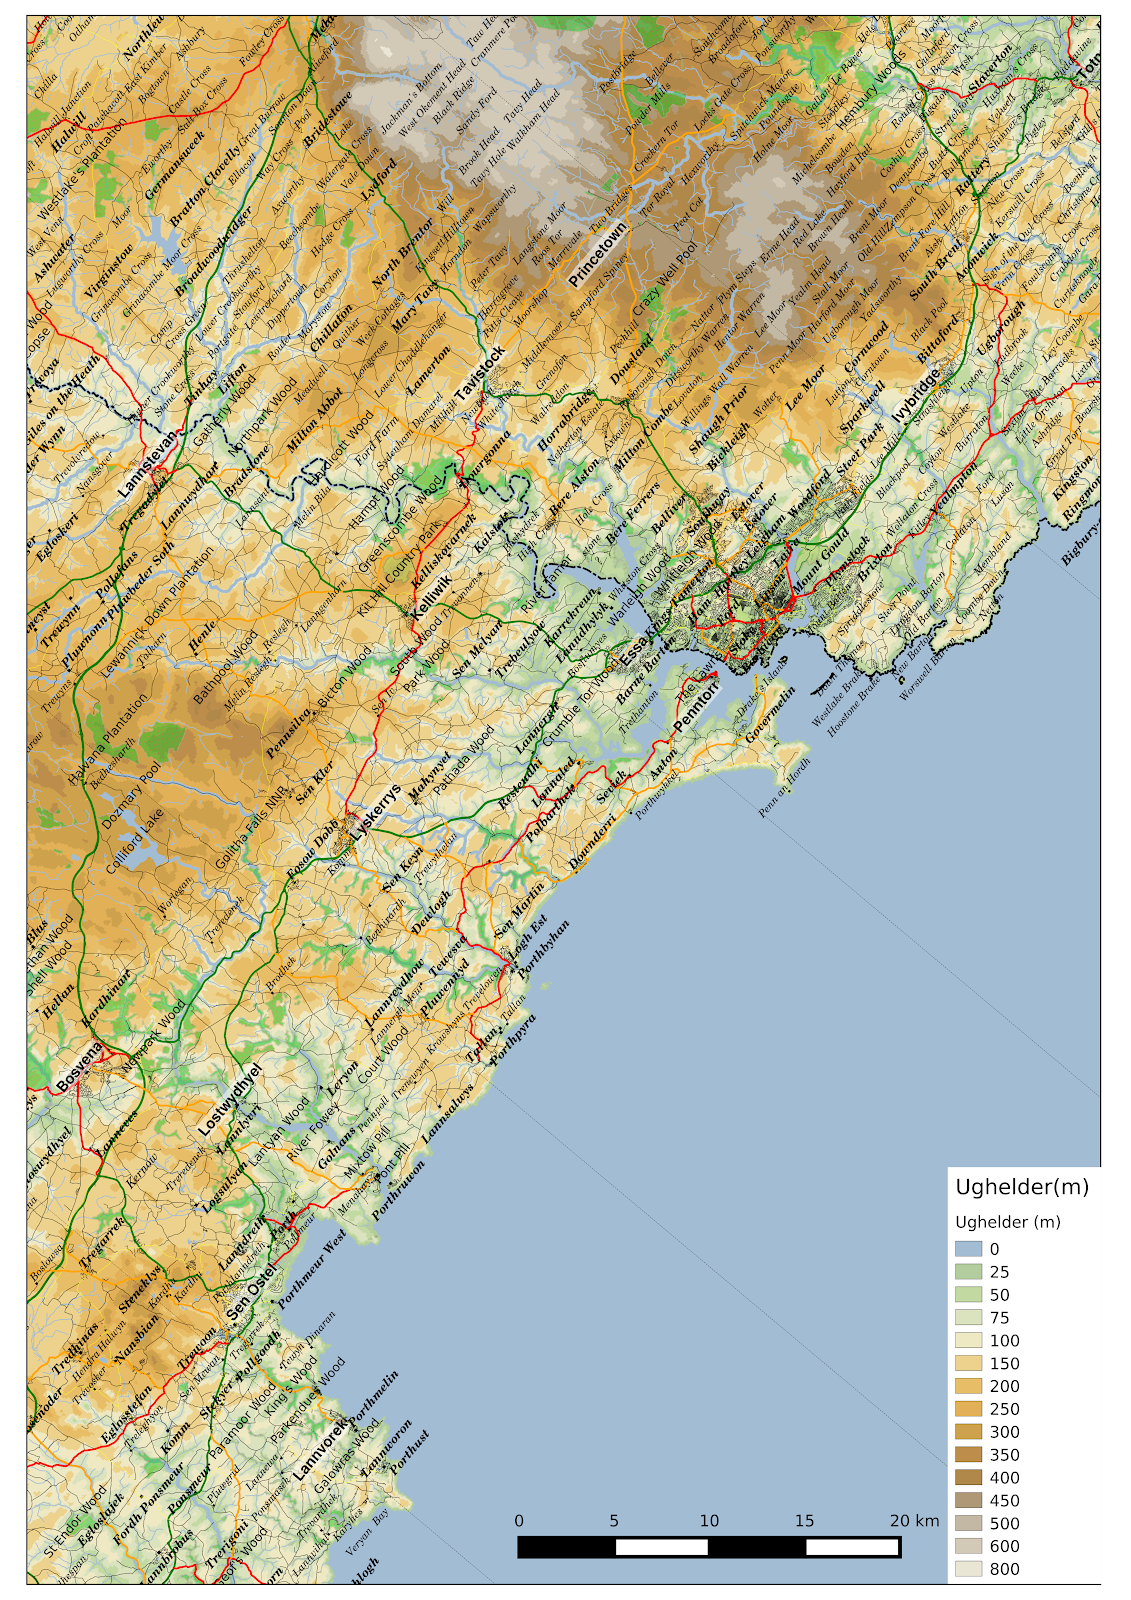
Nevertheless I keep search distance L=1000m.Cornwall, rotated by 50 degrees
Having had Graham Robb's "The Ancient Paths" for Christmas, I note that the author noted the importance of the bearing of the rising Sun on the summer solstice to the ancient Celts of Gaul.
So here are a few maps of Cornwall which have been rotated such that 50 degrees east of North is up:
I've also altered the elevation pallete to make fuller use of it compared to my previous maps.

So here are a few maps of Cornwall which have been rotated such that 50 degrees east of North is up:
I've also altered the elevation pallete to make fuller use of it compared to my previous maps.
Using QGIS profiler plugin to compare 2m resolution LiDAR vs SRTM
I have an idea to produce an elevation aware cycling route planner, and the first step in that is to have some elevation data in the form of a Digital Terrain Model.
The most commonly used freely available digital elevation data is that derived from the Shuttle Radar Topography Mission. At the latitude of Cornwall (about 50 degrees N) it has a resolution of about 73m x 73m per cell.
There is however a possibility of getting LiDAR data (free for non-commercial use) from the UK Environment Agency, which has various resolutions, and I obtained some 2m resolution data for an area around Truro.
For a cycling route planner, it would be nice to be able to keep track of the smaller bumps that would be smoothed out by the SRTM data. However it might not be practical to use the high resolution data because once one considers larger areas the volume of data becomes very large indeed.
There is also the Terrain 50m raster data available through the Ordnance Survey website.
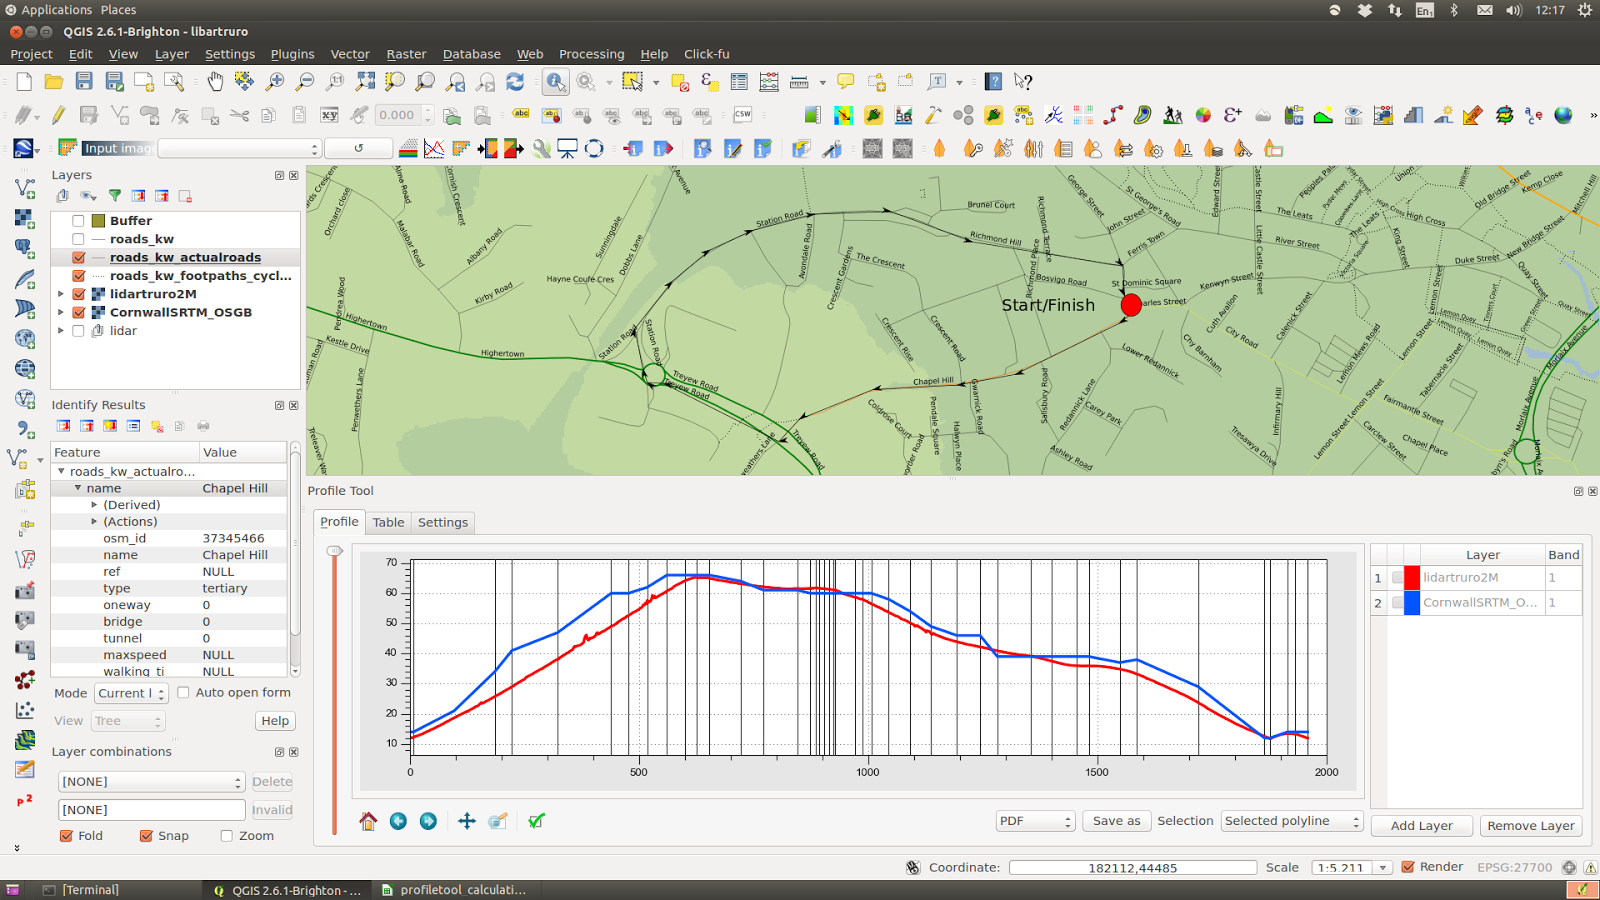
I wished to see what difference it would make on a simple test circular route in Truro. I chose one which starts off climbing a hill, then goes along relatively flat terrain and then back down the hill again by a different route.
The QGIS screenshot below shows using the "Profile Tool" QGIS plugin, where the darker shade of green is the lower elevation terrain. You may need to click on the image to view it in a larger format.
 The actual profile itself showing the elevation as a function of distance along the path is as follows:
I have had an issue with the QGIS Profile tool, in that I can't currently get it to work from a saved track, rather than 'live' by point and click each time, therefore the 2nd image above is a slightly different path.
Unfortunately the LiDAR has some wildly oscillating values, particularly around 400m from start where the road is in a cutting near the top of Chapel Hill. I have therefore done a moving average smoothing to make them more comparable.
Measuring total ascent, counting the total height gain considering only positive values:
The total ascents were 52m, 55m, 60m, and 75m respectively for the smoothed LiDAR, SRTM, Terrain 50, and unsmoothed LiDAR respectively.
In the early part of the track, the SRTM (red line) appears to be seeing the treetops or roofs of buildings either side of Chapel Hill, but levels out at a lower peak than the full resolution LiDAR (yellow line). It appears than the LiDAR is overestimating due to proximity of artificial structures, or possibly even vehicles in a traffic jam on the A390. The smoothed LiDAR follows the SRTM fairly closely.
The most commonly used freely available digital elevation data is that derived from the Shuttle Radar Topography Mission. At the latitude of Cornwall (about 50 degrees N) it has a resolution of about 73m x 73m per cell.
There is however a possibility of getting LiDAR data (free for non-commercial use) from the UK Environment Agency, which has various resolutions, and I obtained some 2m resolution data for an area around Truro.
For a cycling route planner, it would be nice to be able to keep track of the smaller bumps that would be smoothed out by the SRTM data. However it might not be practical to use the high resolution data because once one considers larger areas the volume of data becomes very large indeed.
There is also the Terrain 50m raster data available through the Ordnance Survey website.
I wished to see what difference it would make on a simple test circular route in Truro. I chose one which starts off climbing a hill, then goes along relatively flat terrain and then back down the hill again by a different route.
The QGIS screenshot below shows using the "Profile Tool" QGIS plugin, where the darker shade of green is the lower elevation terrain. You may need to click on the image to view it in a larger format.
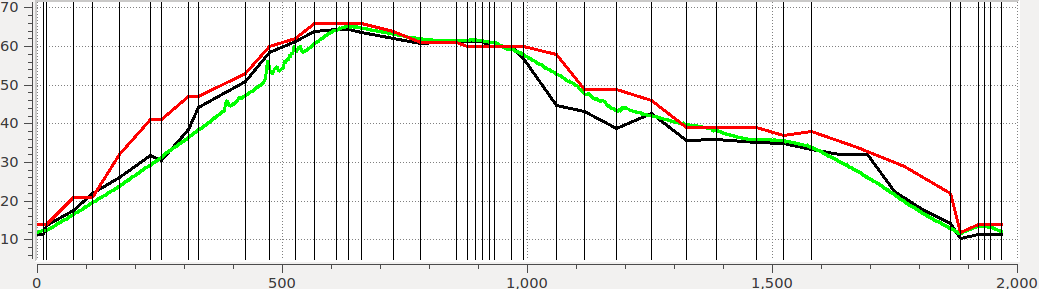 |
| SRTM = red, OS Terrain50 = black, 2m LiDAR = green |
Unfortunately the LiDAR has some wildly oscillating values, particularly around 400m from start where the road is in a cutting near the top of Chapel Hill. I have therefore done a moving average smoothing to make them more comparable.
 |
| Although the OS Terrain 50m is a higher resolution dataset, it appears to have more artifacts than the SRTM which is ~73m at this latitude |
Measuring total ascent, counting the total height gain considering only positive values:
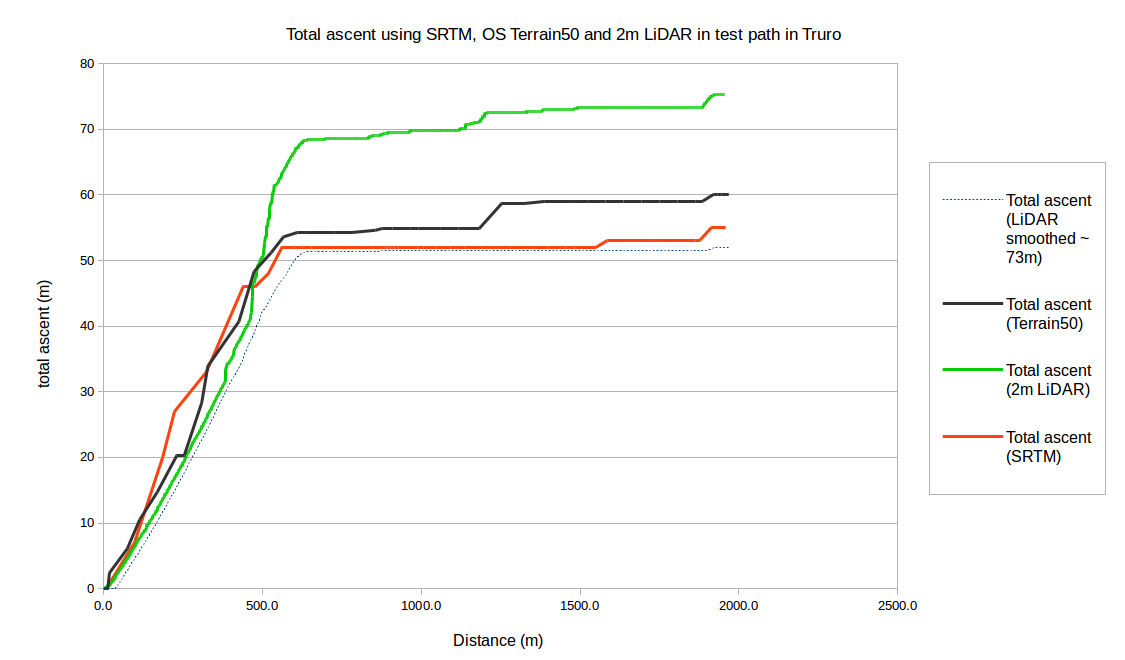 |
| Not a big difference in total ascent between SRTM and Terrain 50. I also made an estimate by inspection of a 1:25k OS map of 55m ascent. |
The total ascents were 52m, 55m, 60m, and 75m respectively for the smoothed LiDAR, SRTM, Terrain 50, and unsmoothed LiDAR respectively.
In the early part of the track, the SRTM (red line) appears to be seeing the treetops or roofs of buildings either side of Chapel Hill, but levels out at a lower peak than the full resolution LiDAR (yellow line). It appears than the LiDAR is overestimating due to proximity of artificial structures, or possibly even vehicles in a traffic jam on the A390. The smoothed LiDAR follows the SRTM fairly closely.
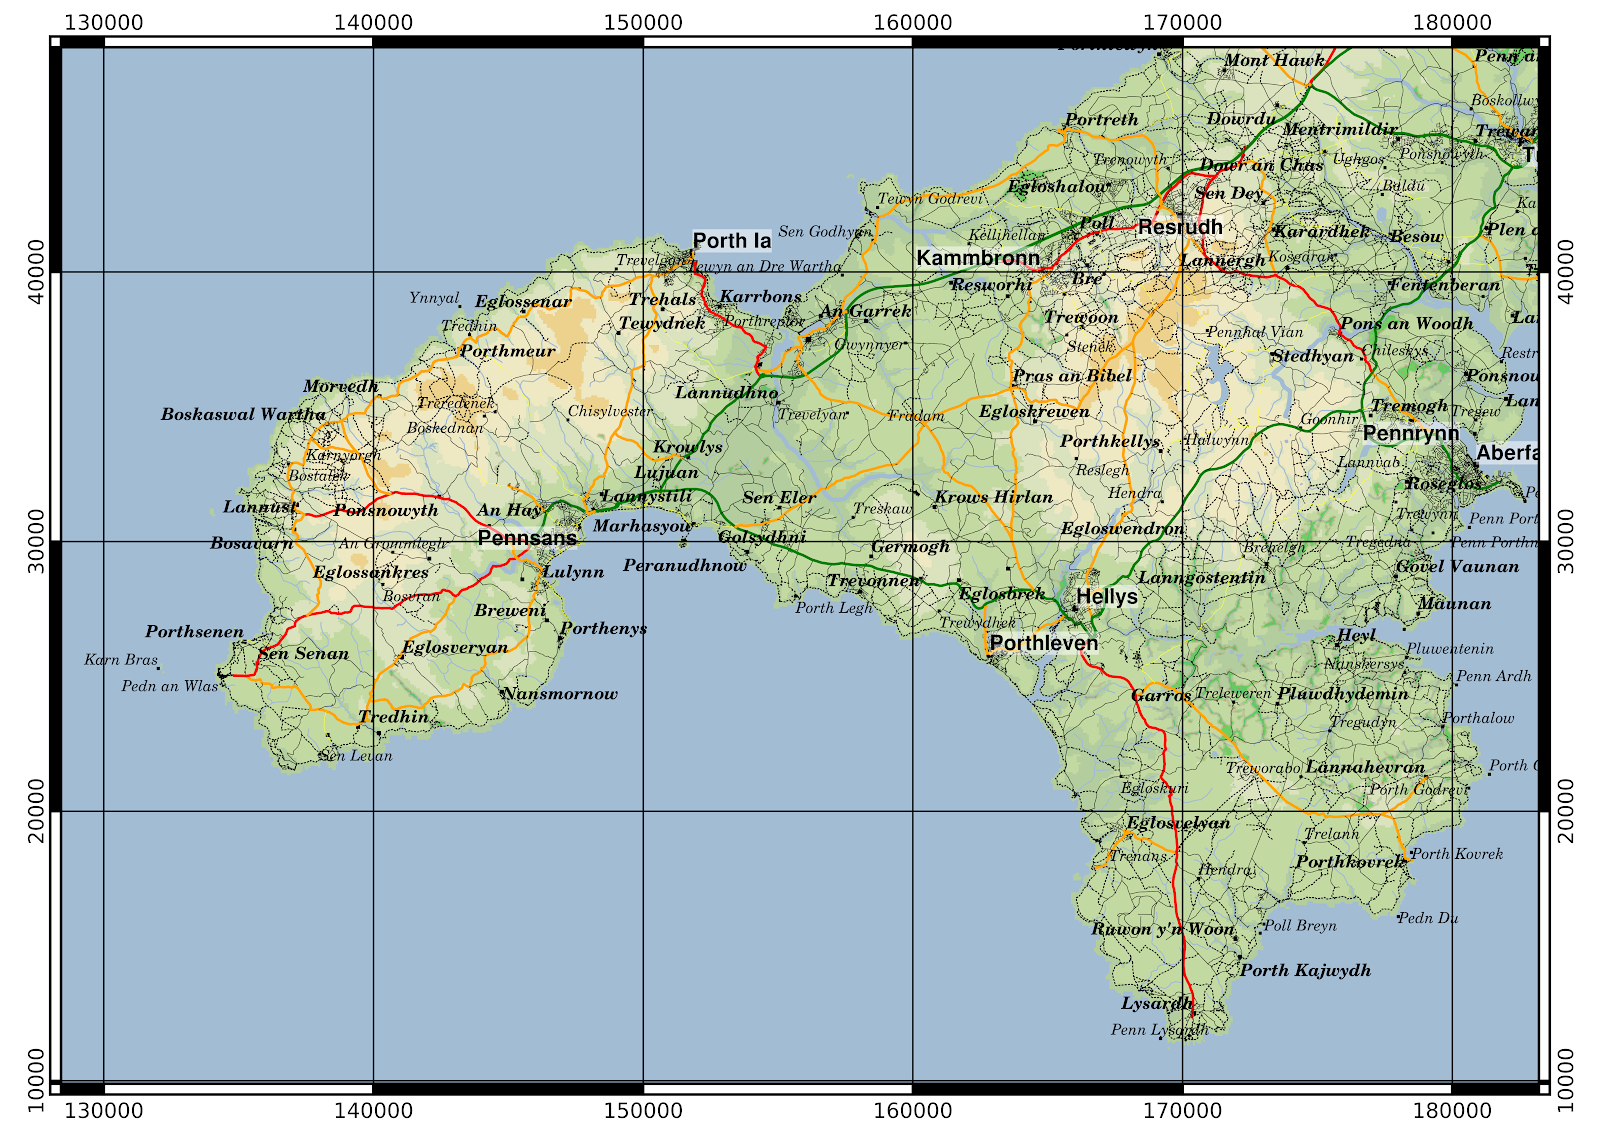
Improved version of Cornwall maps in Cornish
As I said in my previous post, there were some areas such as river estuaries showing land where which is actually water.
Using layers from www.mapcruzin.com (ultimately from OpenStreetMap) I add inland water, rivers, woodland and parks (semitransparent overplot).
Using data dependent properties in QGIS, vary plotting of label text dependent on type (e.g. town, village) as specific in the placename layer.
edit: The Cornish placenames themselves are the list in the Standard Written Form produced by the MAGA Signage Panel.
Scale of 1:200000 for the below pages printed at A4.
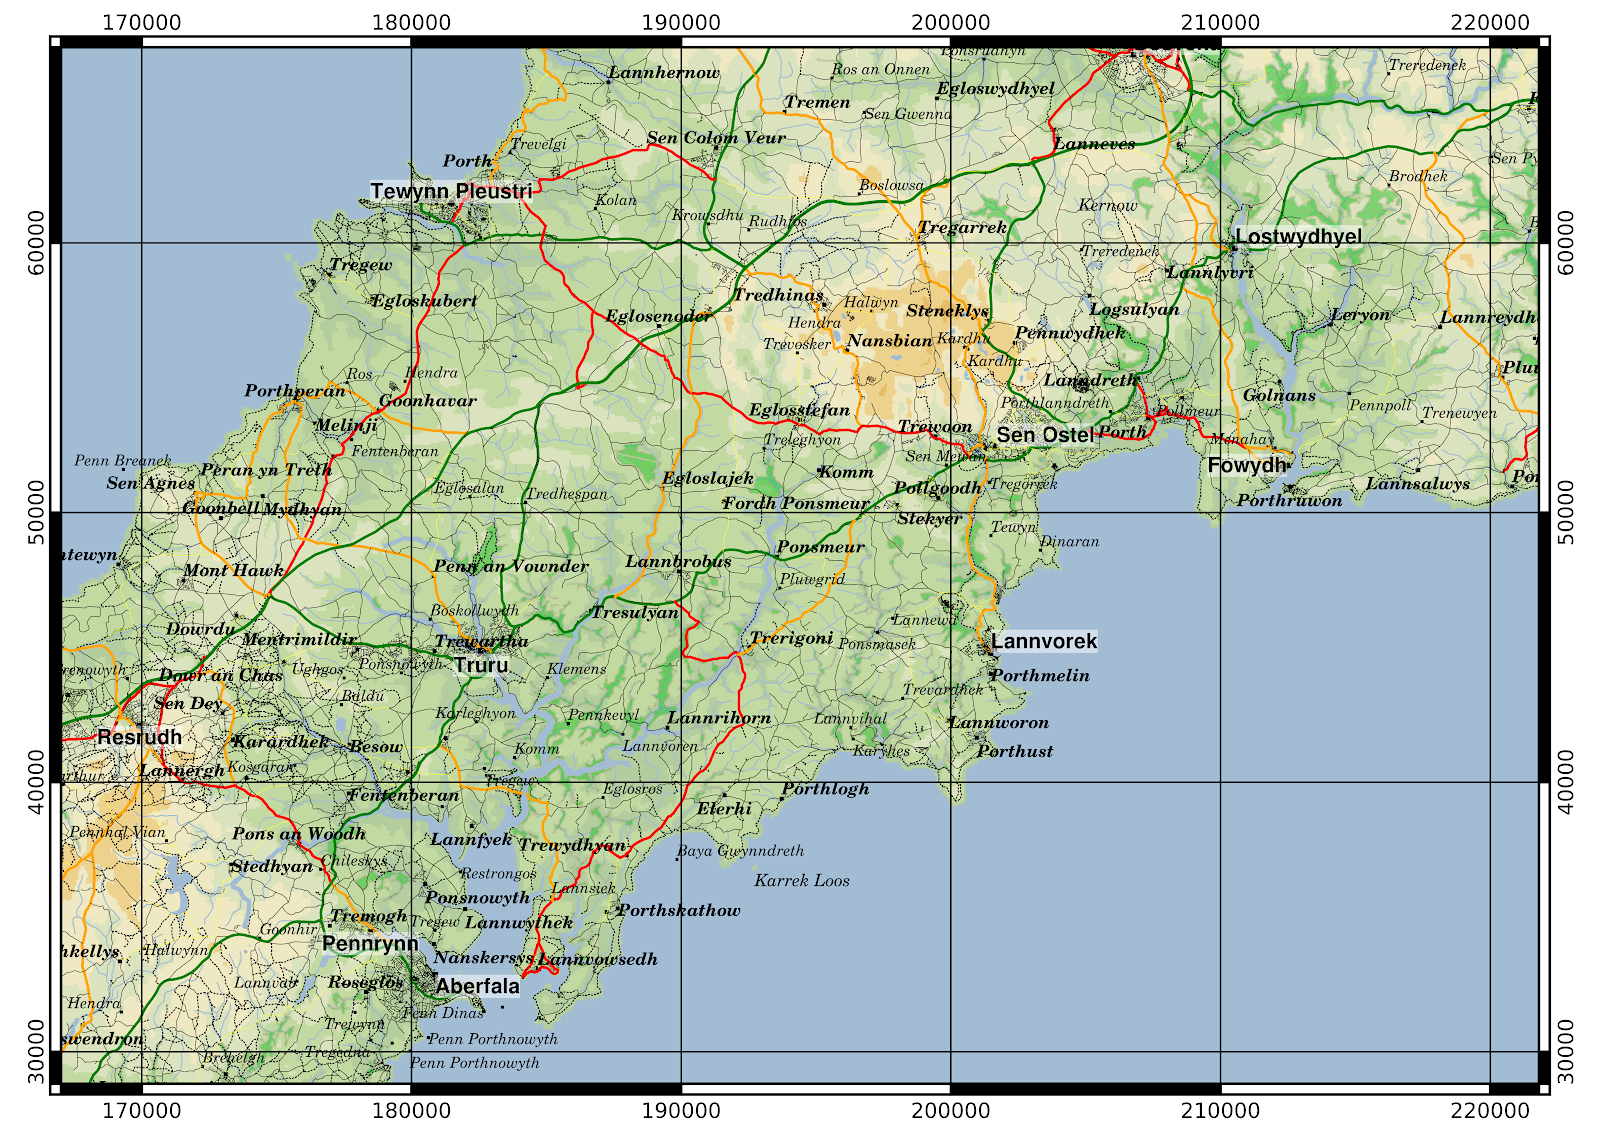
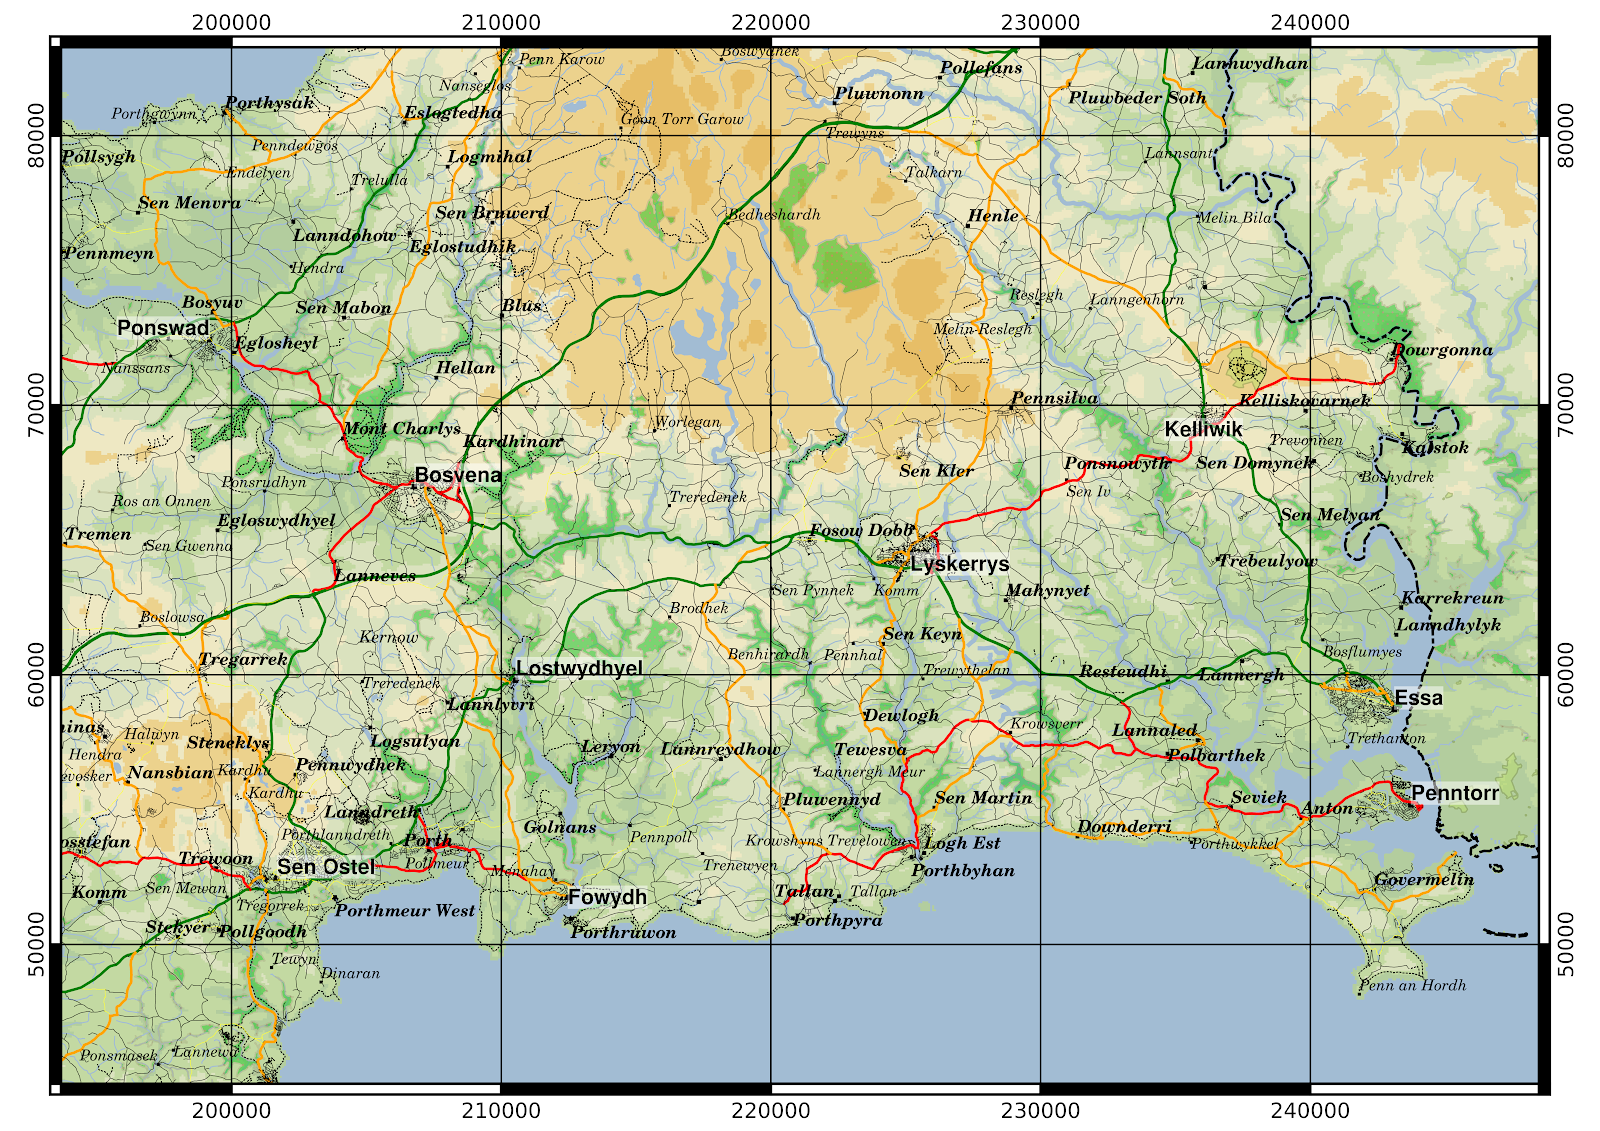 |
| Some manual editing was necessary to ensure the Cornwall/Devon border conforms to the treaty of 936 between kings Athelstan and Huwel. |
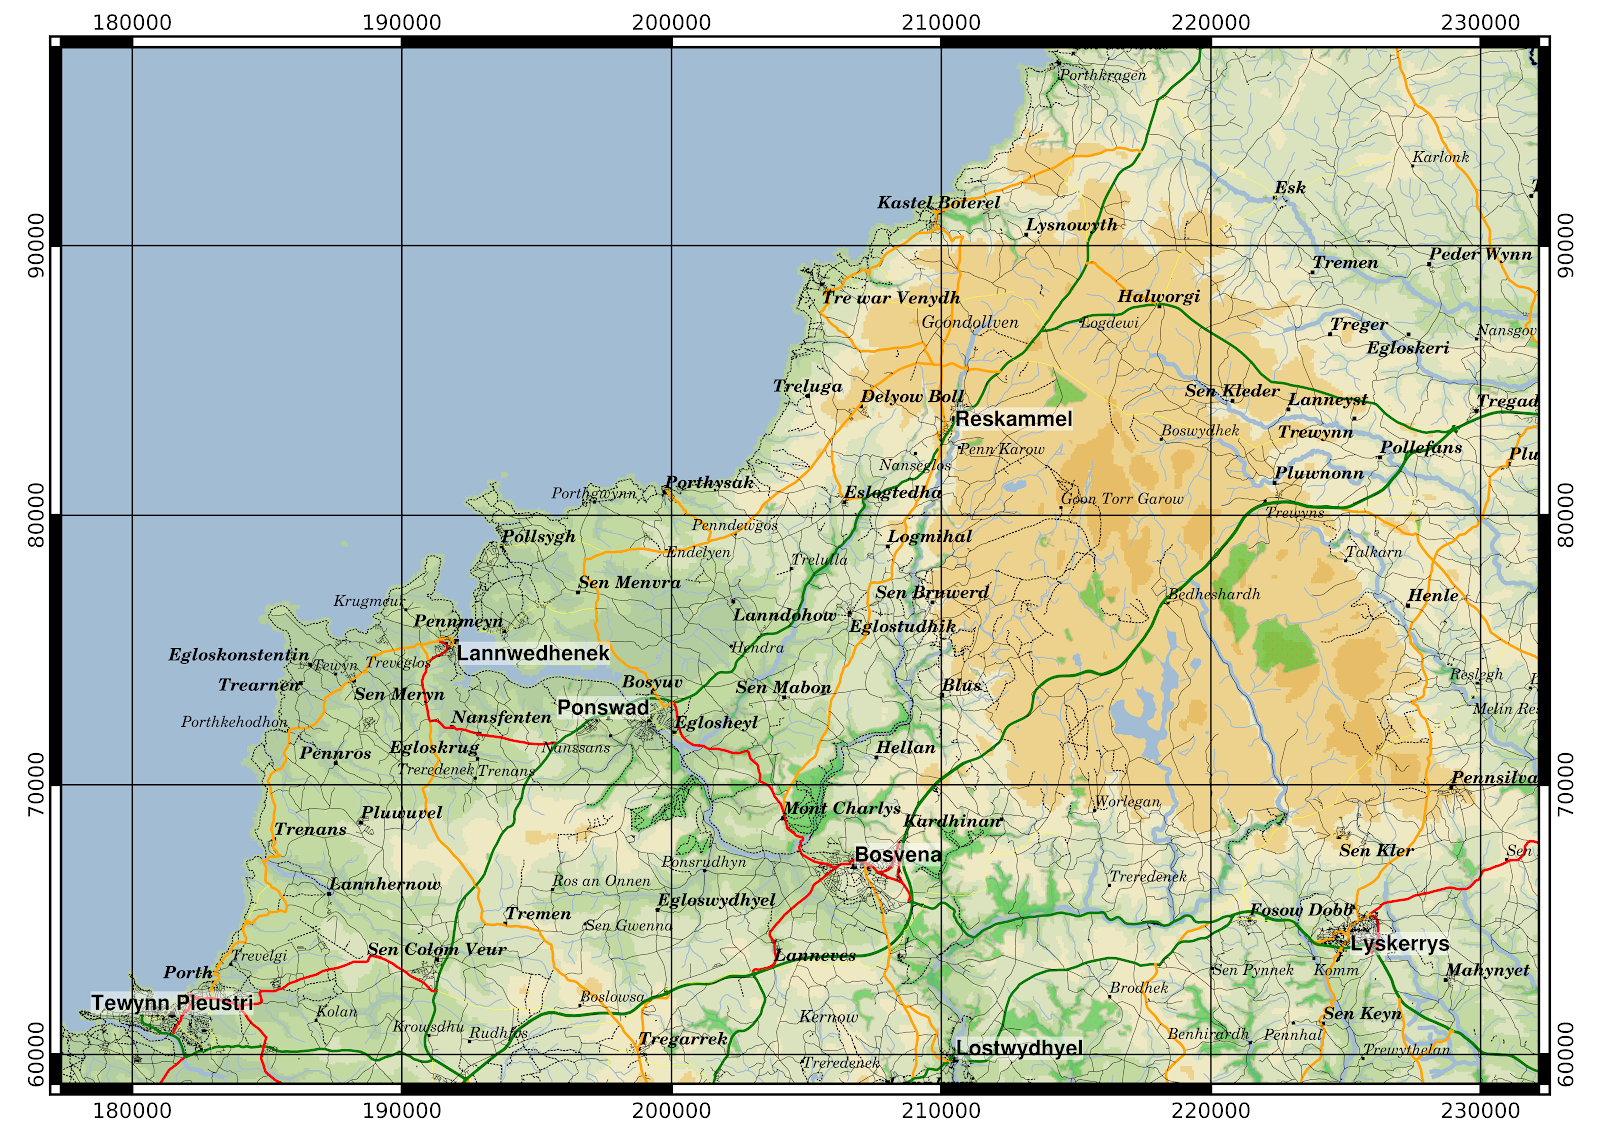
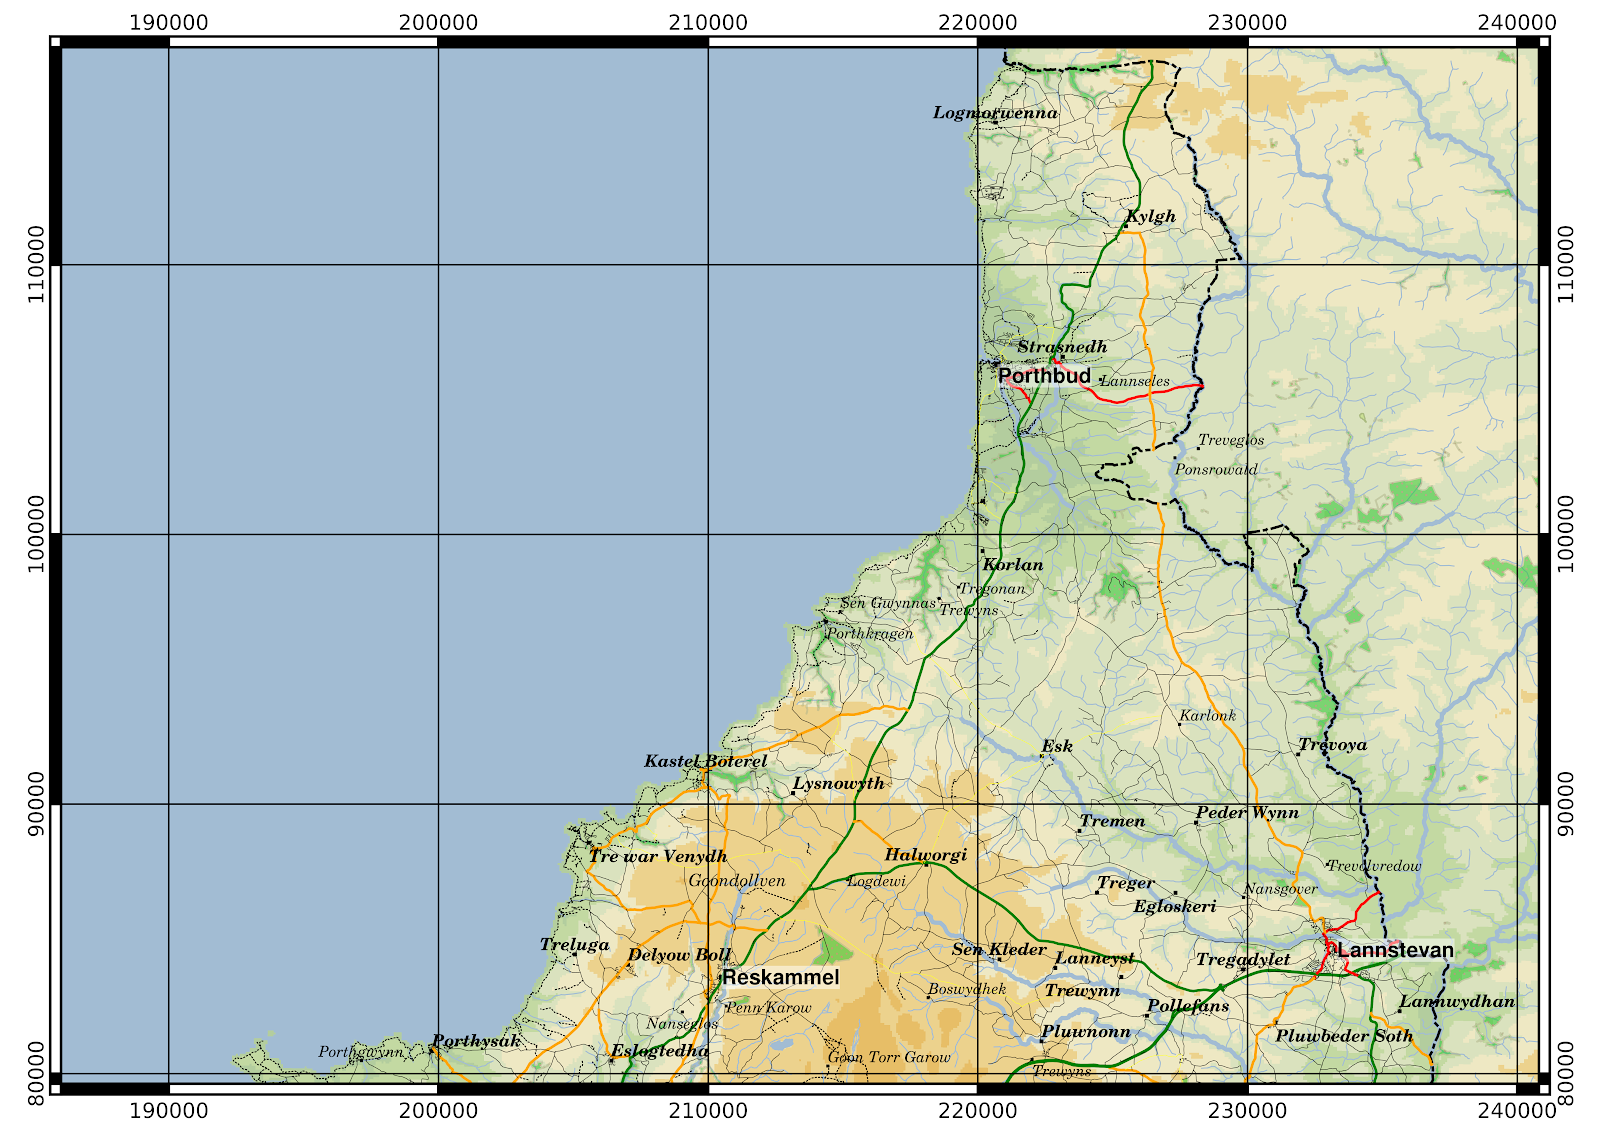
Maps for A3 paper


« Prev
1
2
3
4
5
6
7
8
9
10
11
12
13
14
15
16
17
18
19
20
21
22
23
24
25
26
27
28
29
30
31
32
33
34
35
36
37
38
39
40
41
42
43
44
45
46
47
Next »