Skrifennow
My blog, imported from Blogger and converted using Jekyll.
« Prev
1
2
3
4
5
6
7
8
9
10
11
12
13
14
15
16
17
18
19
20
21
22
23
24
25
26
27
28
29
30
31
32
33
34
35
36
37
38
39
40
41
42
43
44
45
46
47
Next »
The Meriga Project - summary maps
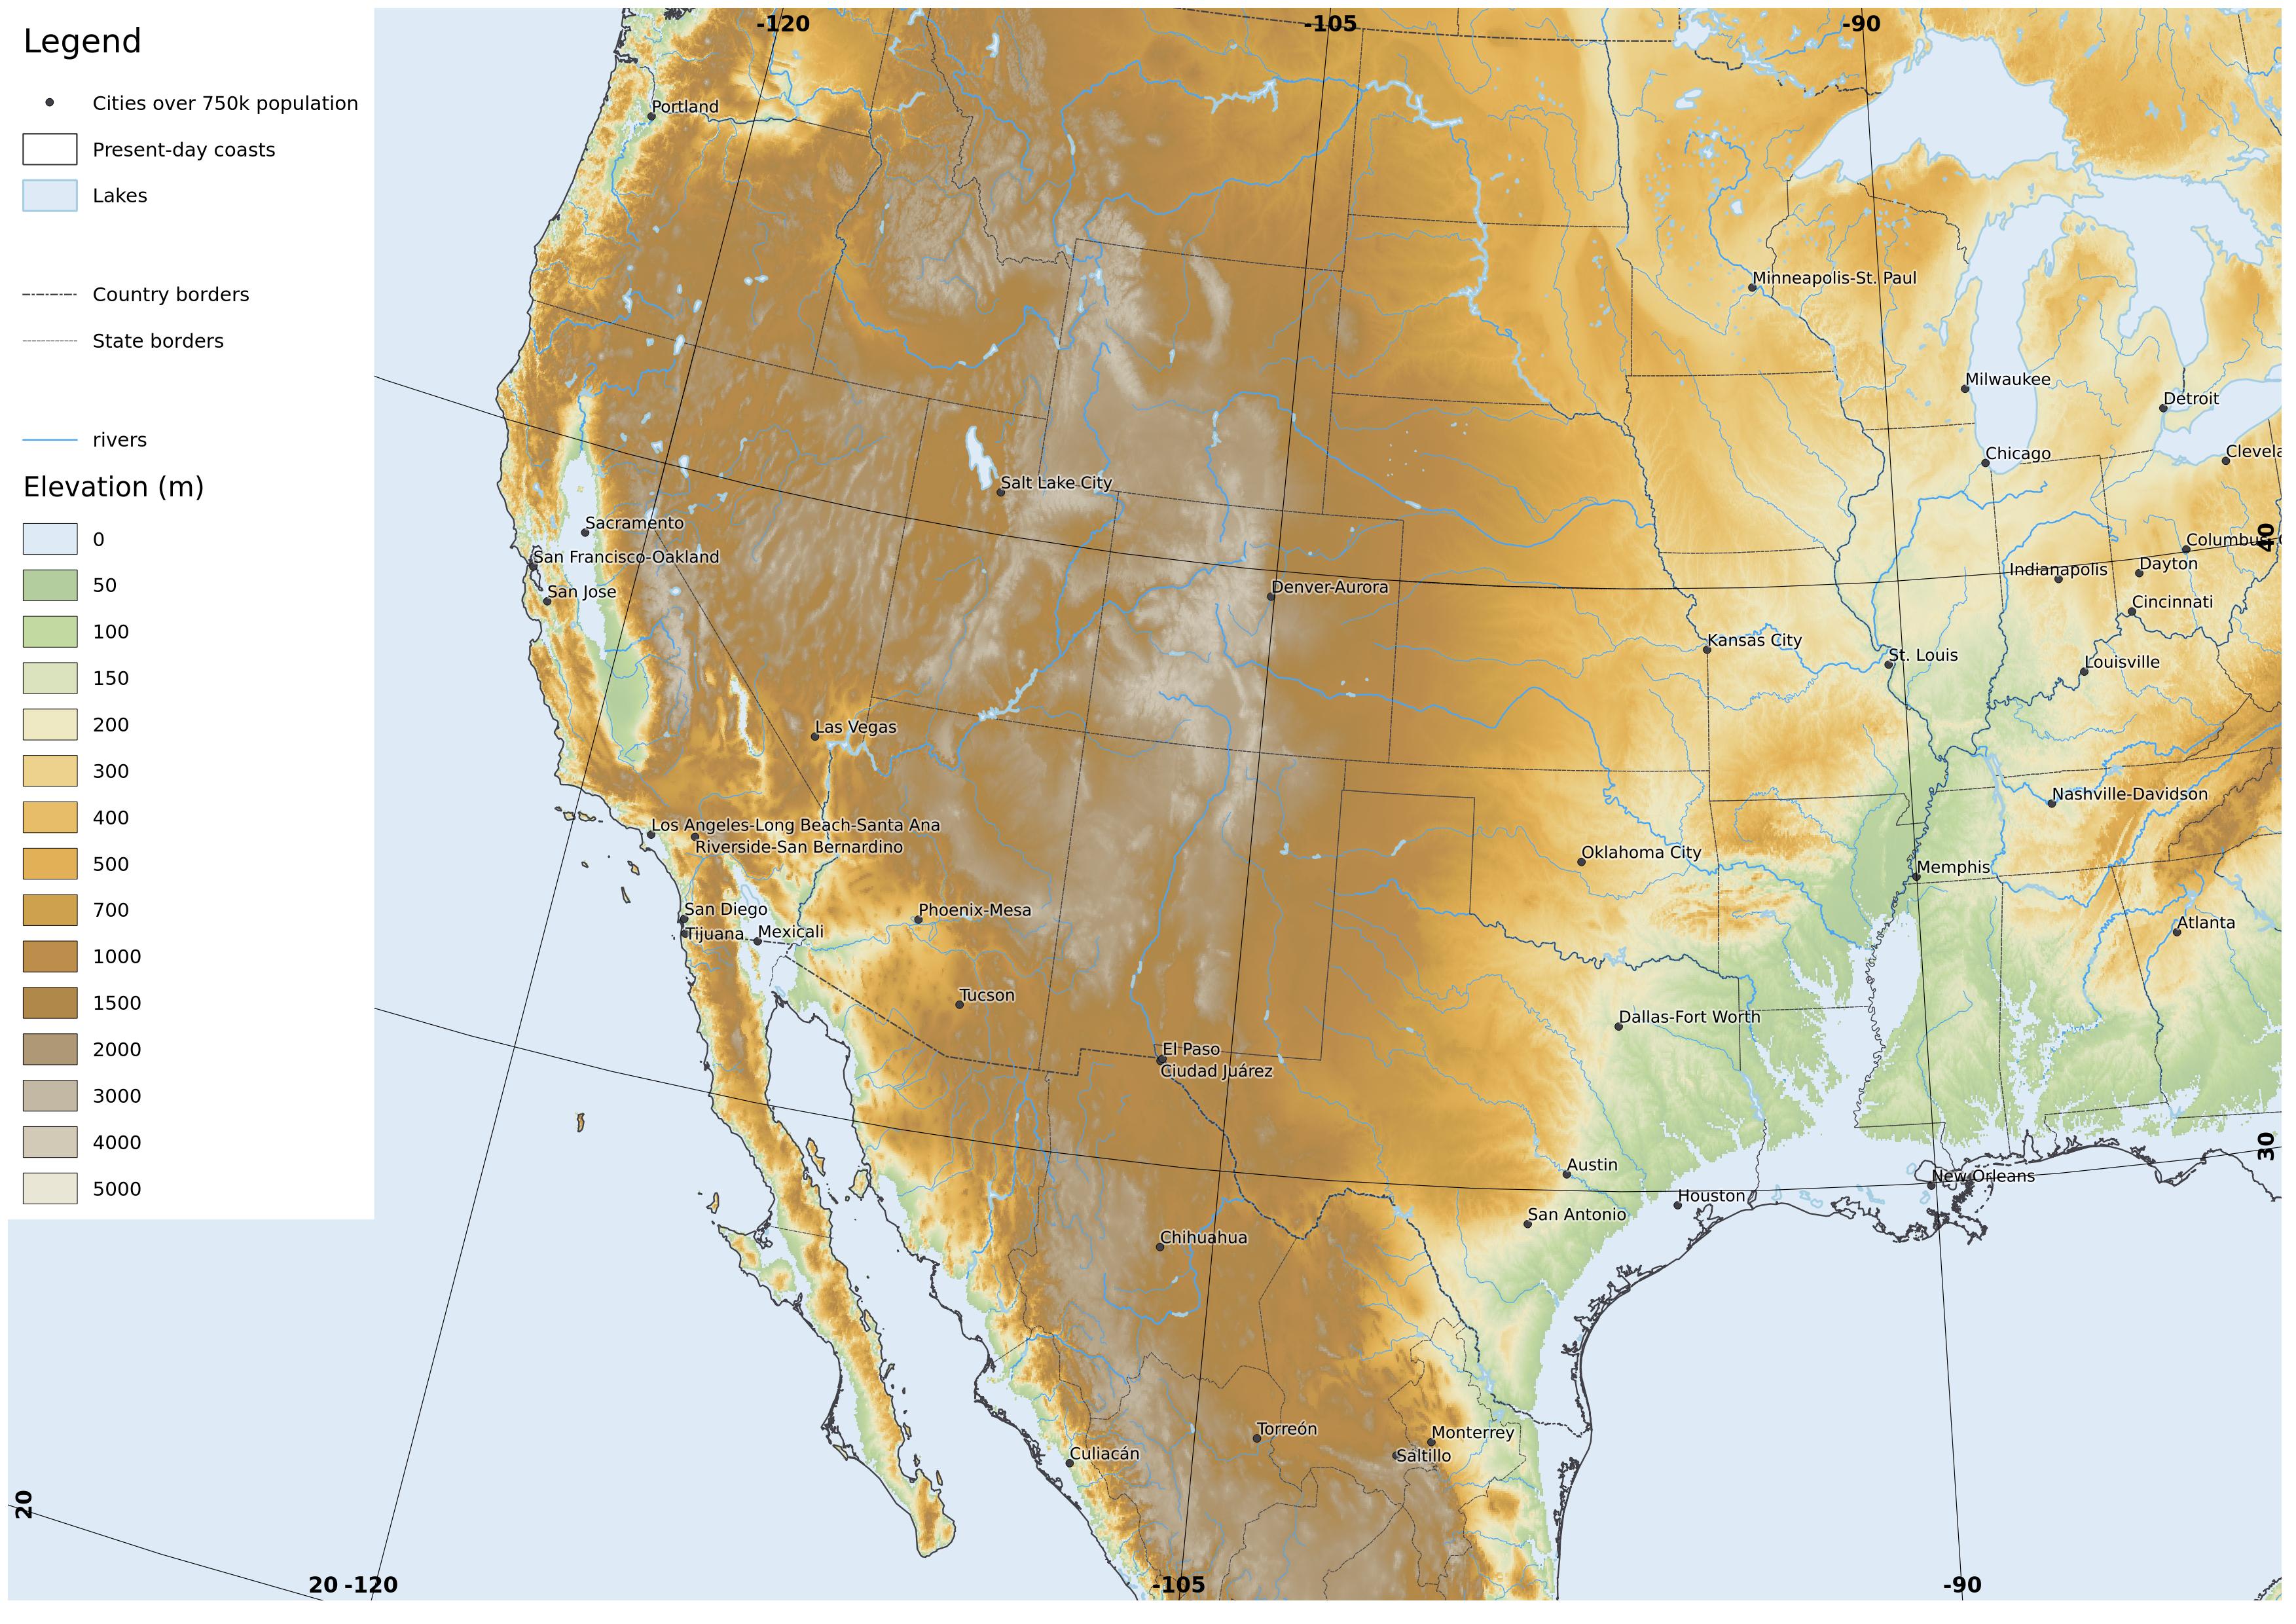
The blogger and author John Michael Greer wrote the book Star's Reach set centuries after the decline of industrial civilisation in the wake of resource depletion and climate change.
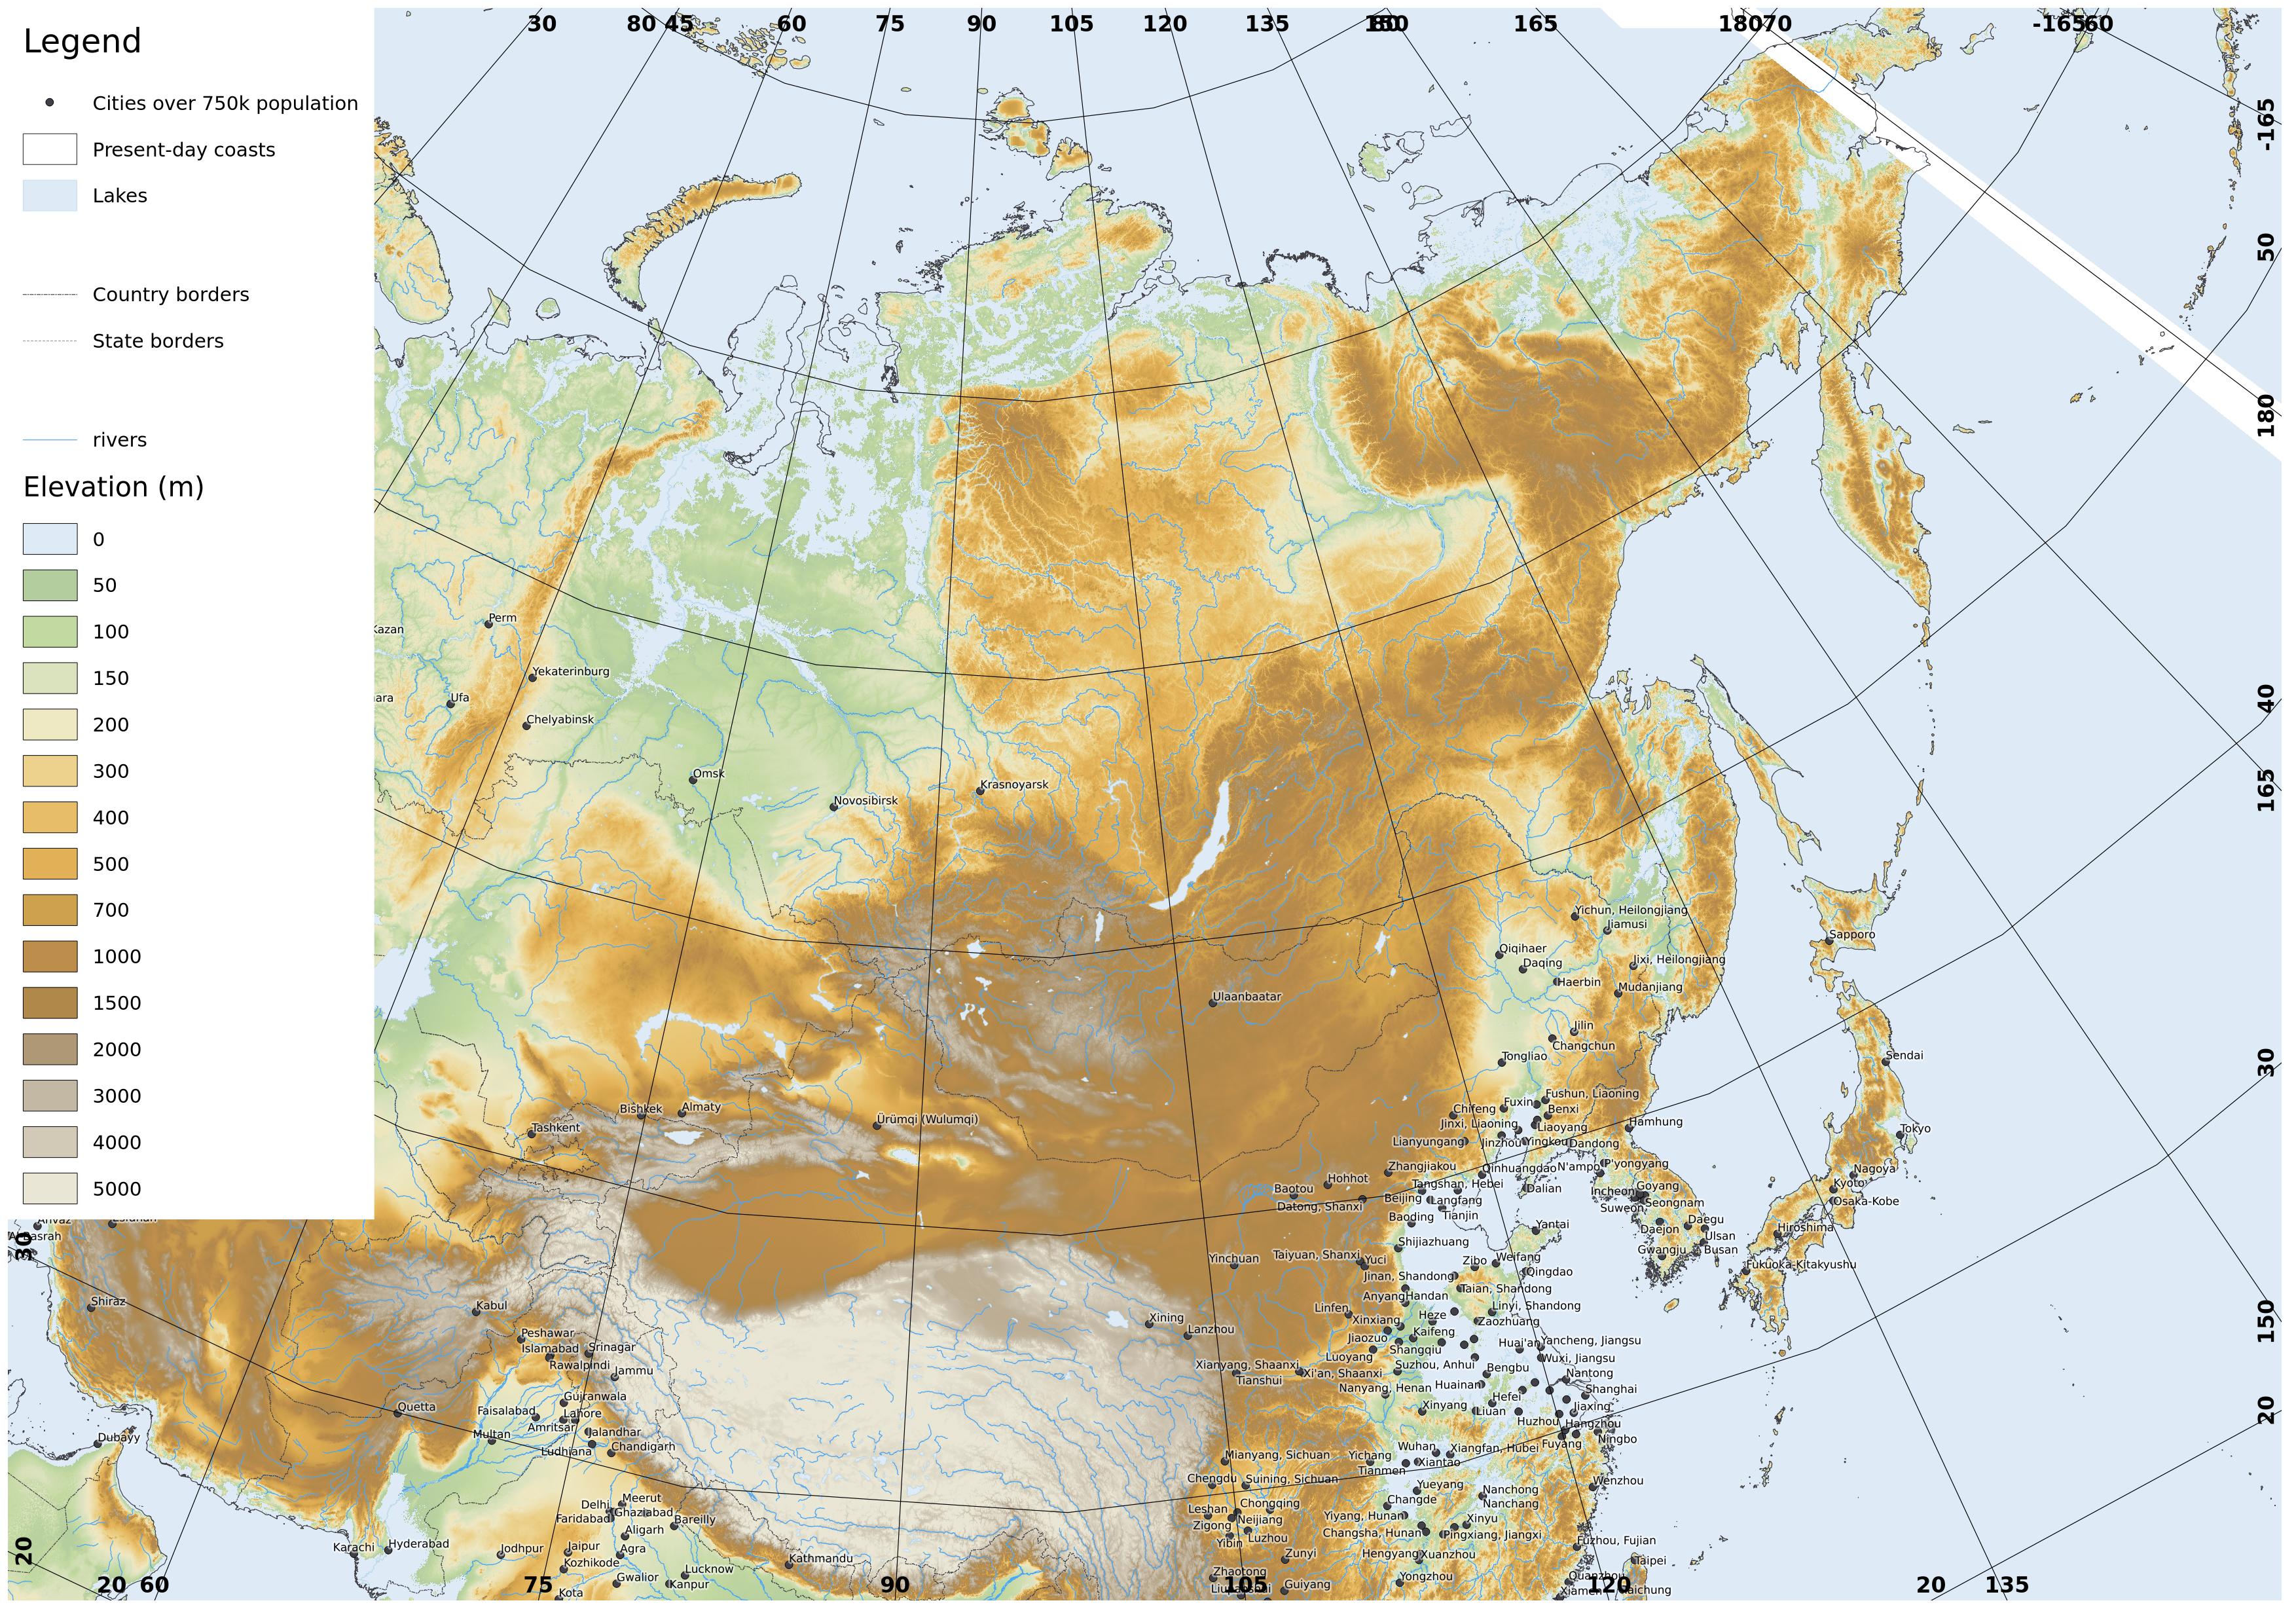
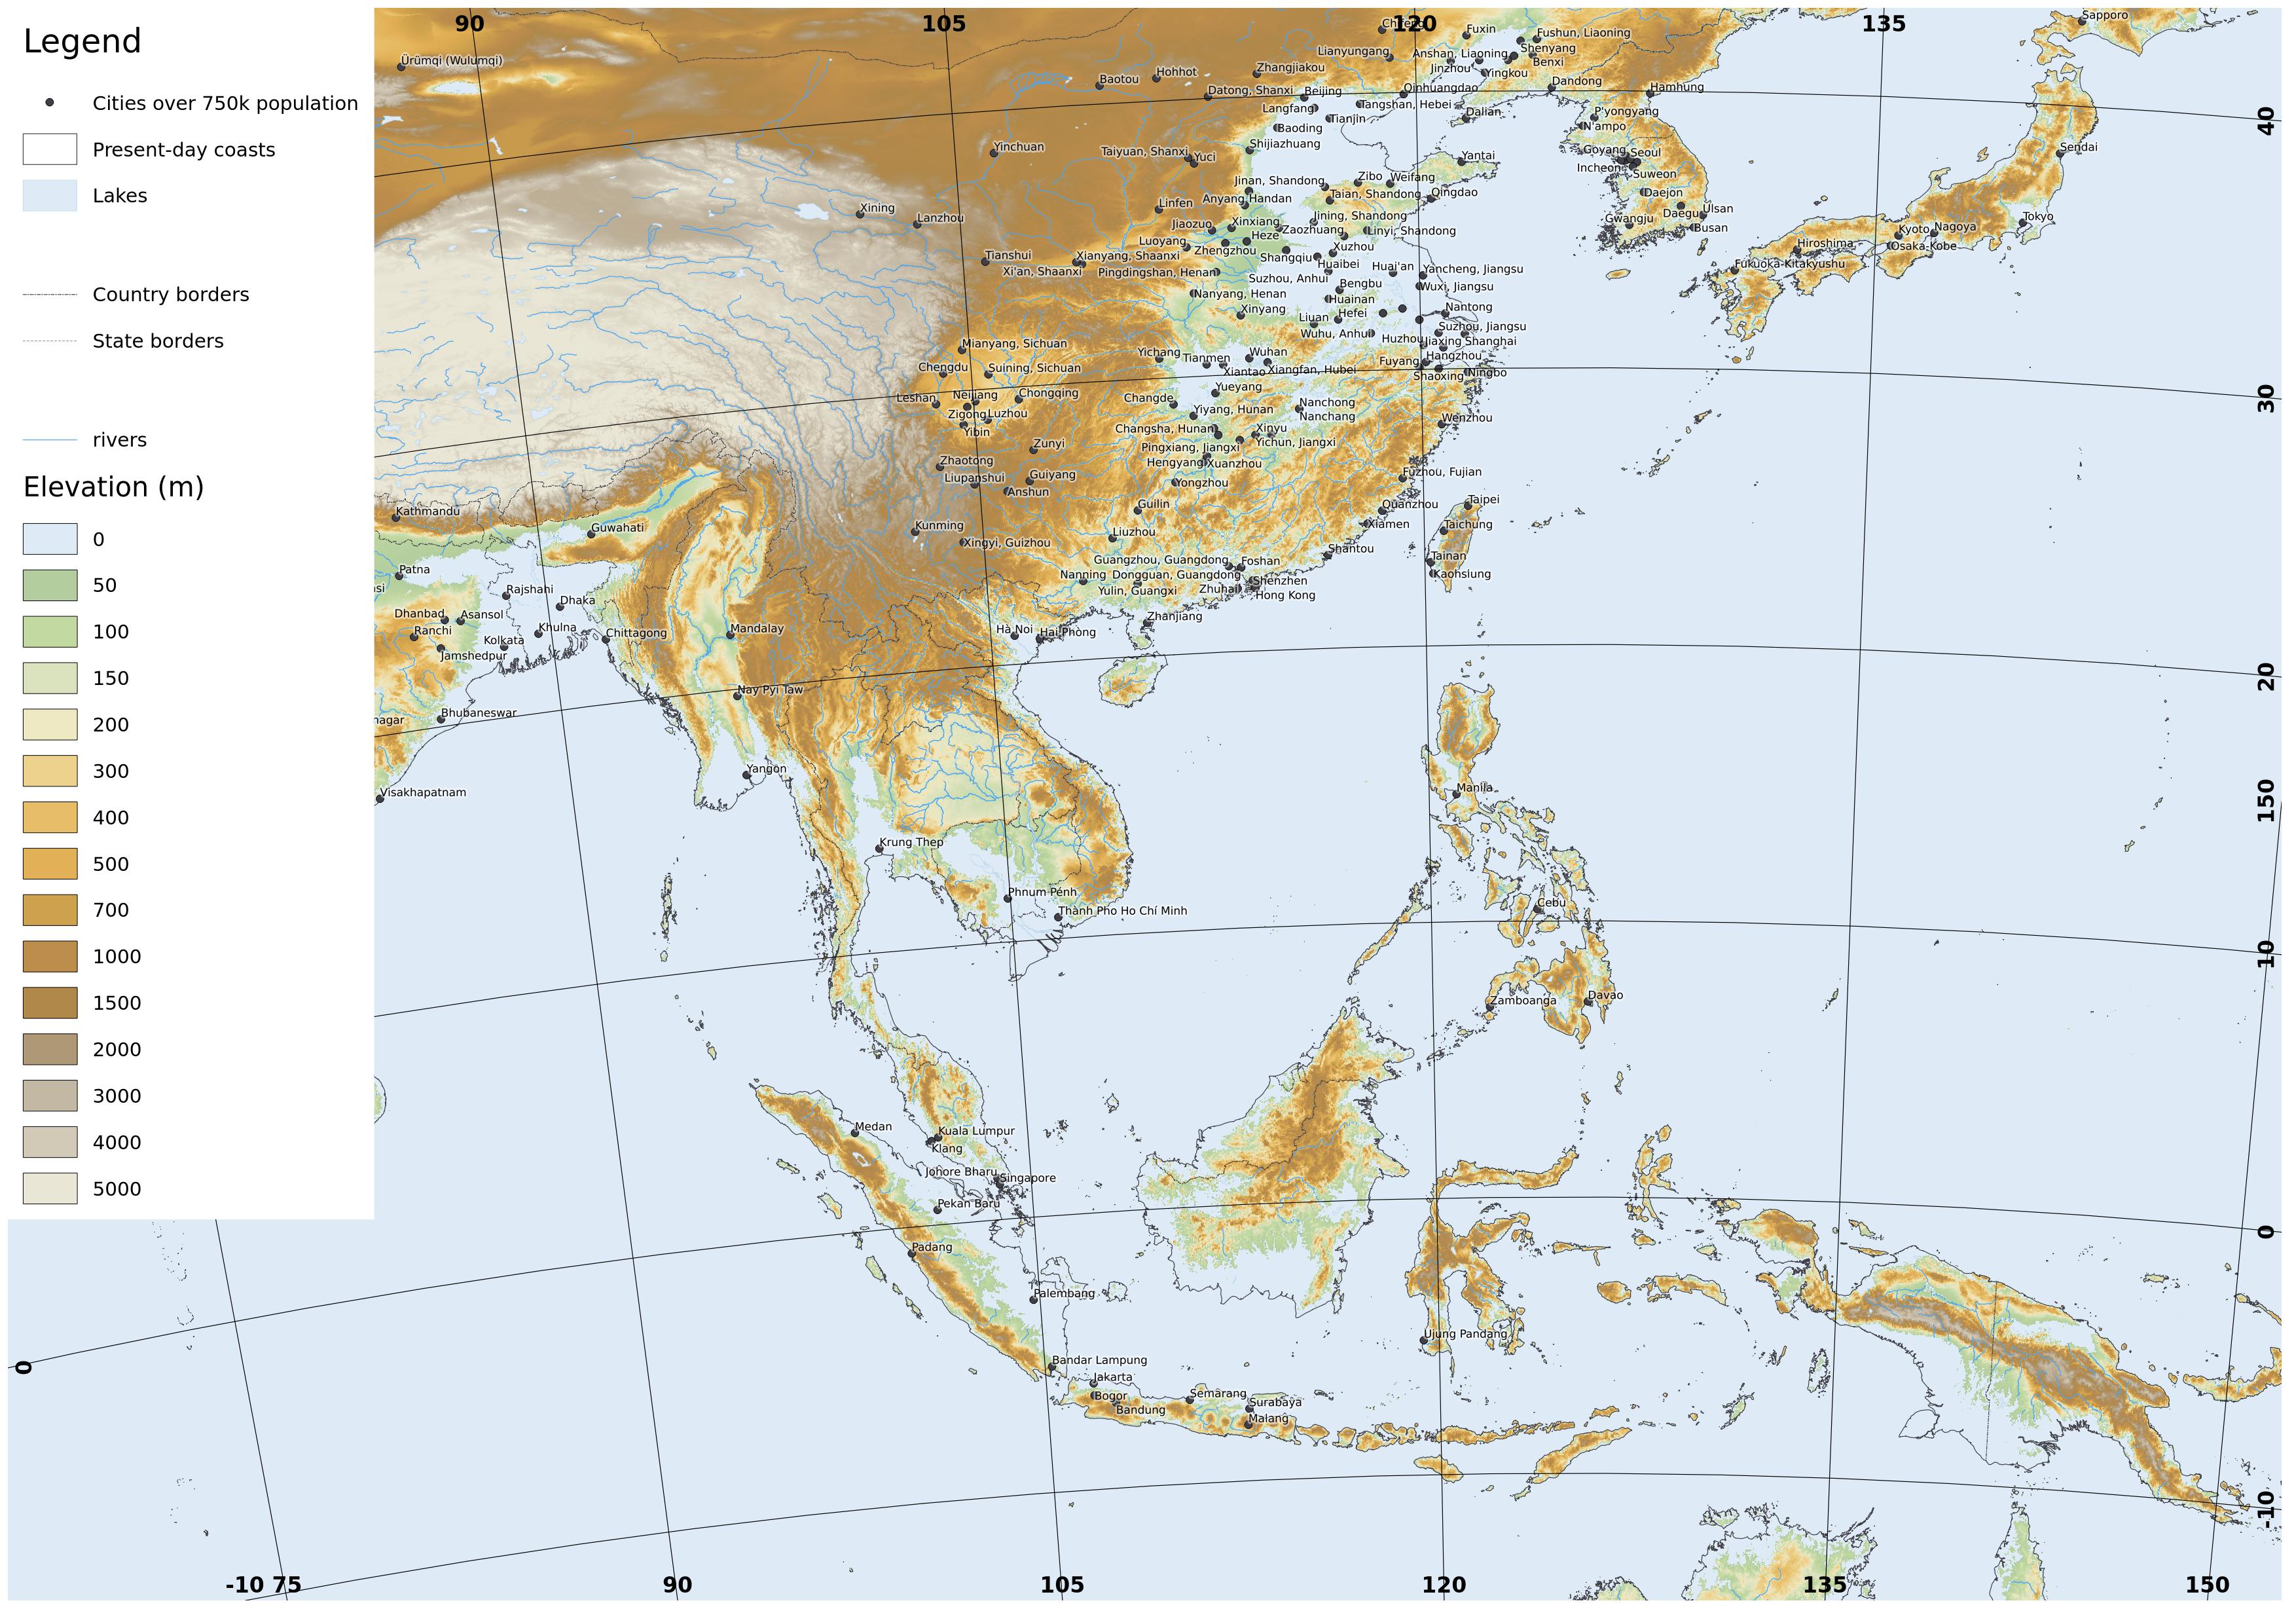
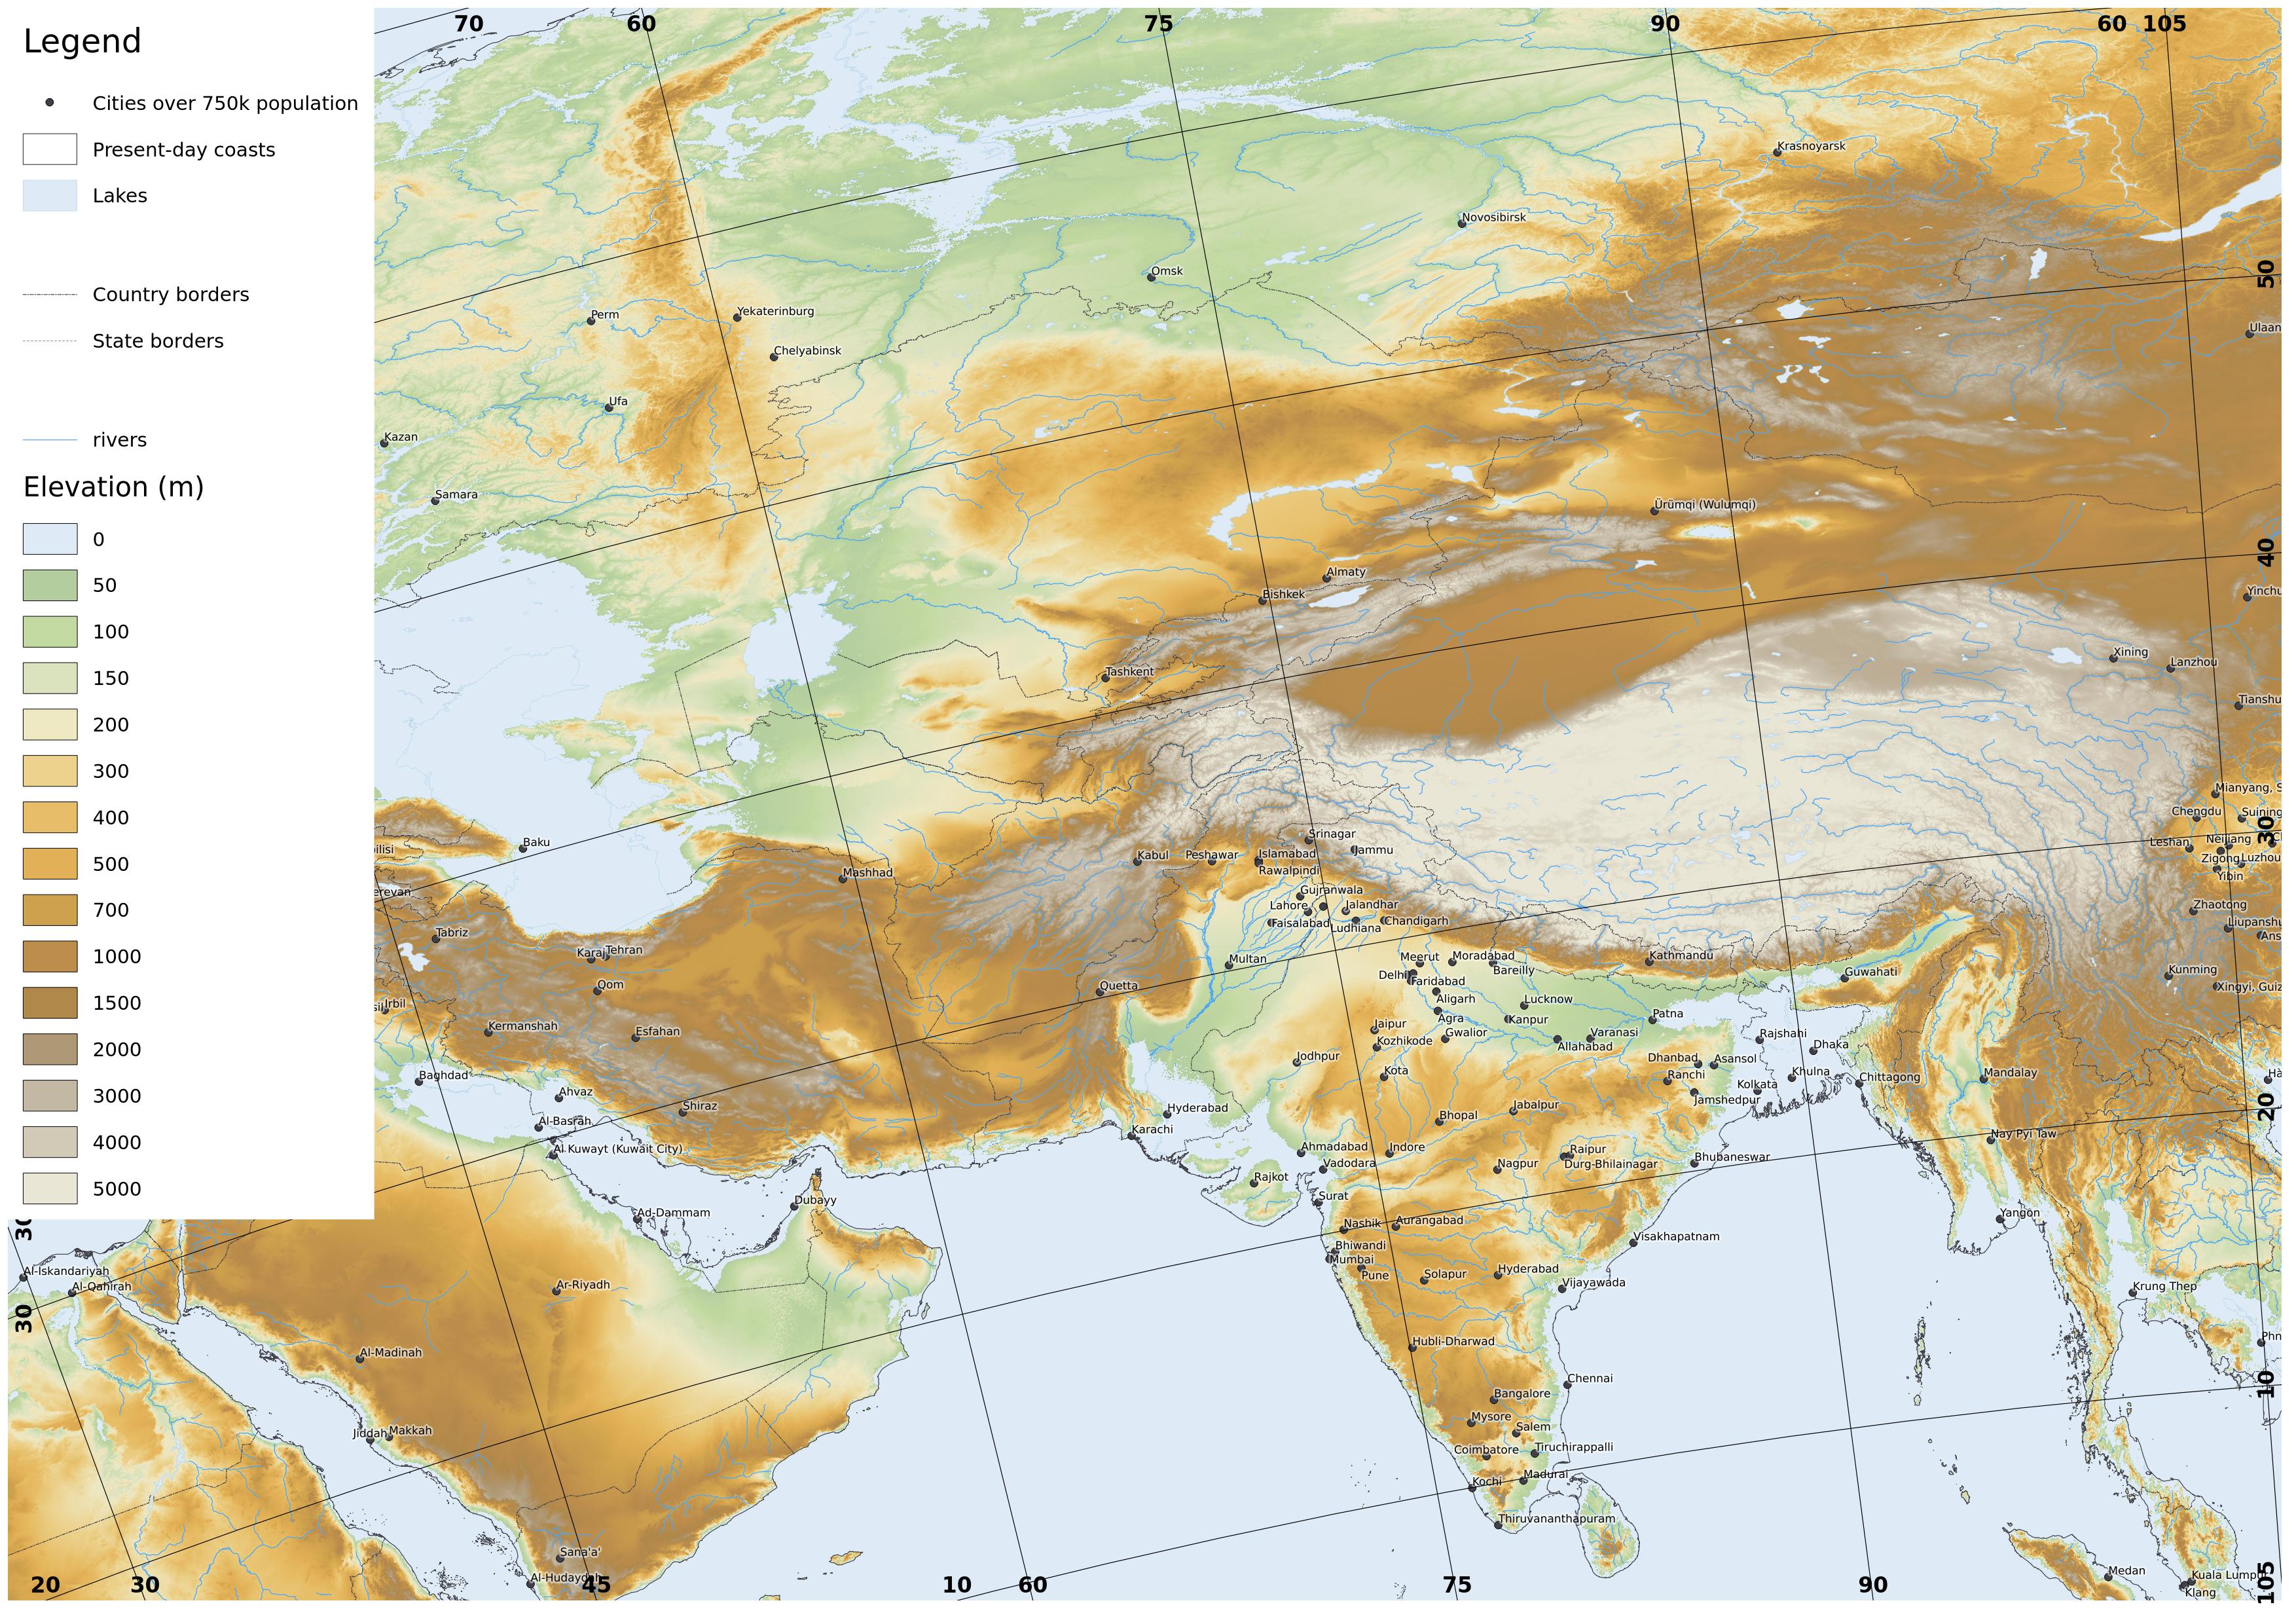
He is now looking for stories for a shared-world anthology set in the same world as Star's Reach, the Meriga Project. In the 25th century, the Greenland ice cap and most of Antarctic ice have melted leaving sea level 50m higher than at present. It is possible to view the effect of this at websites like flood.firetree.net.
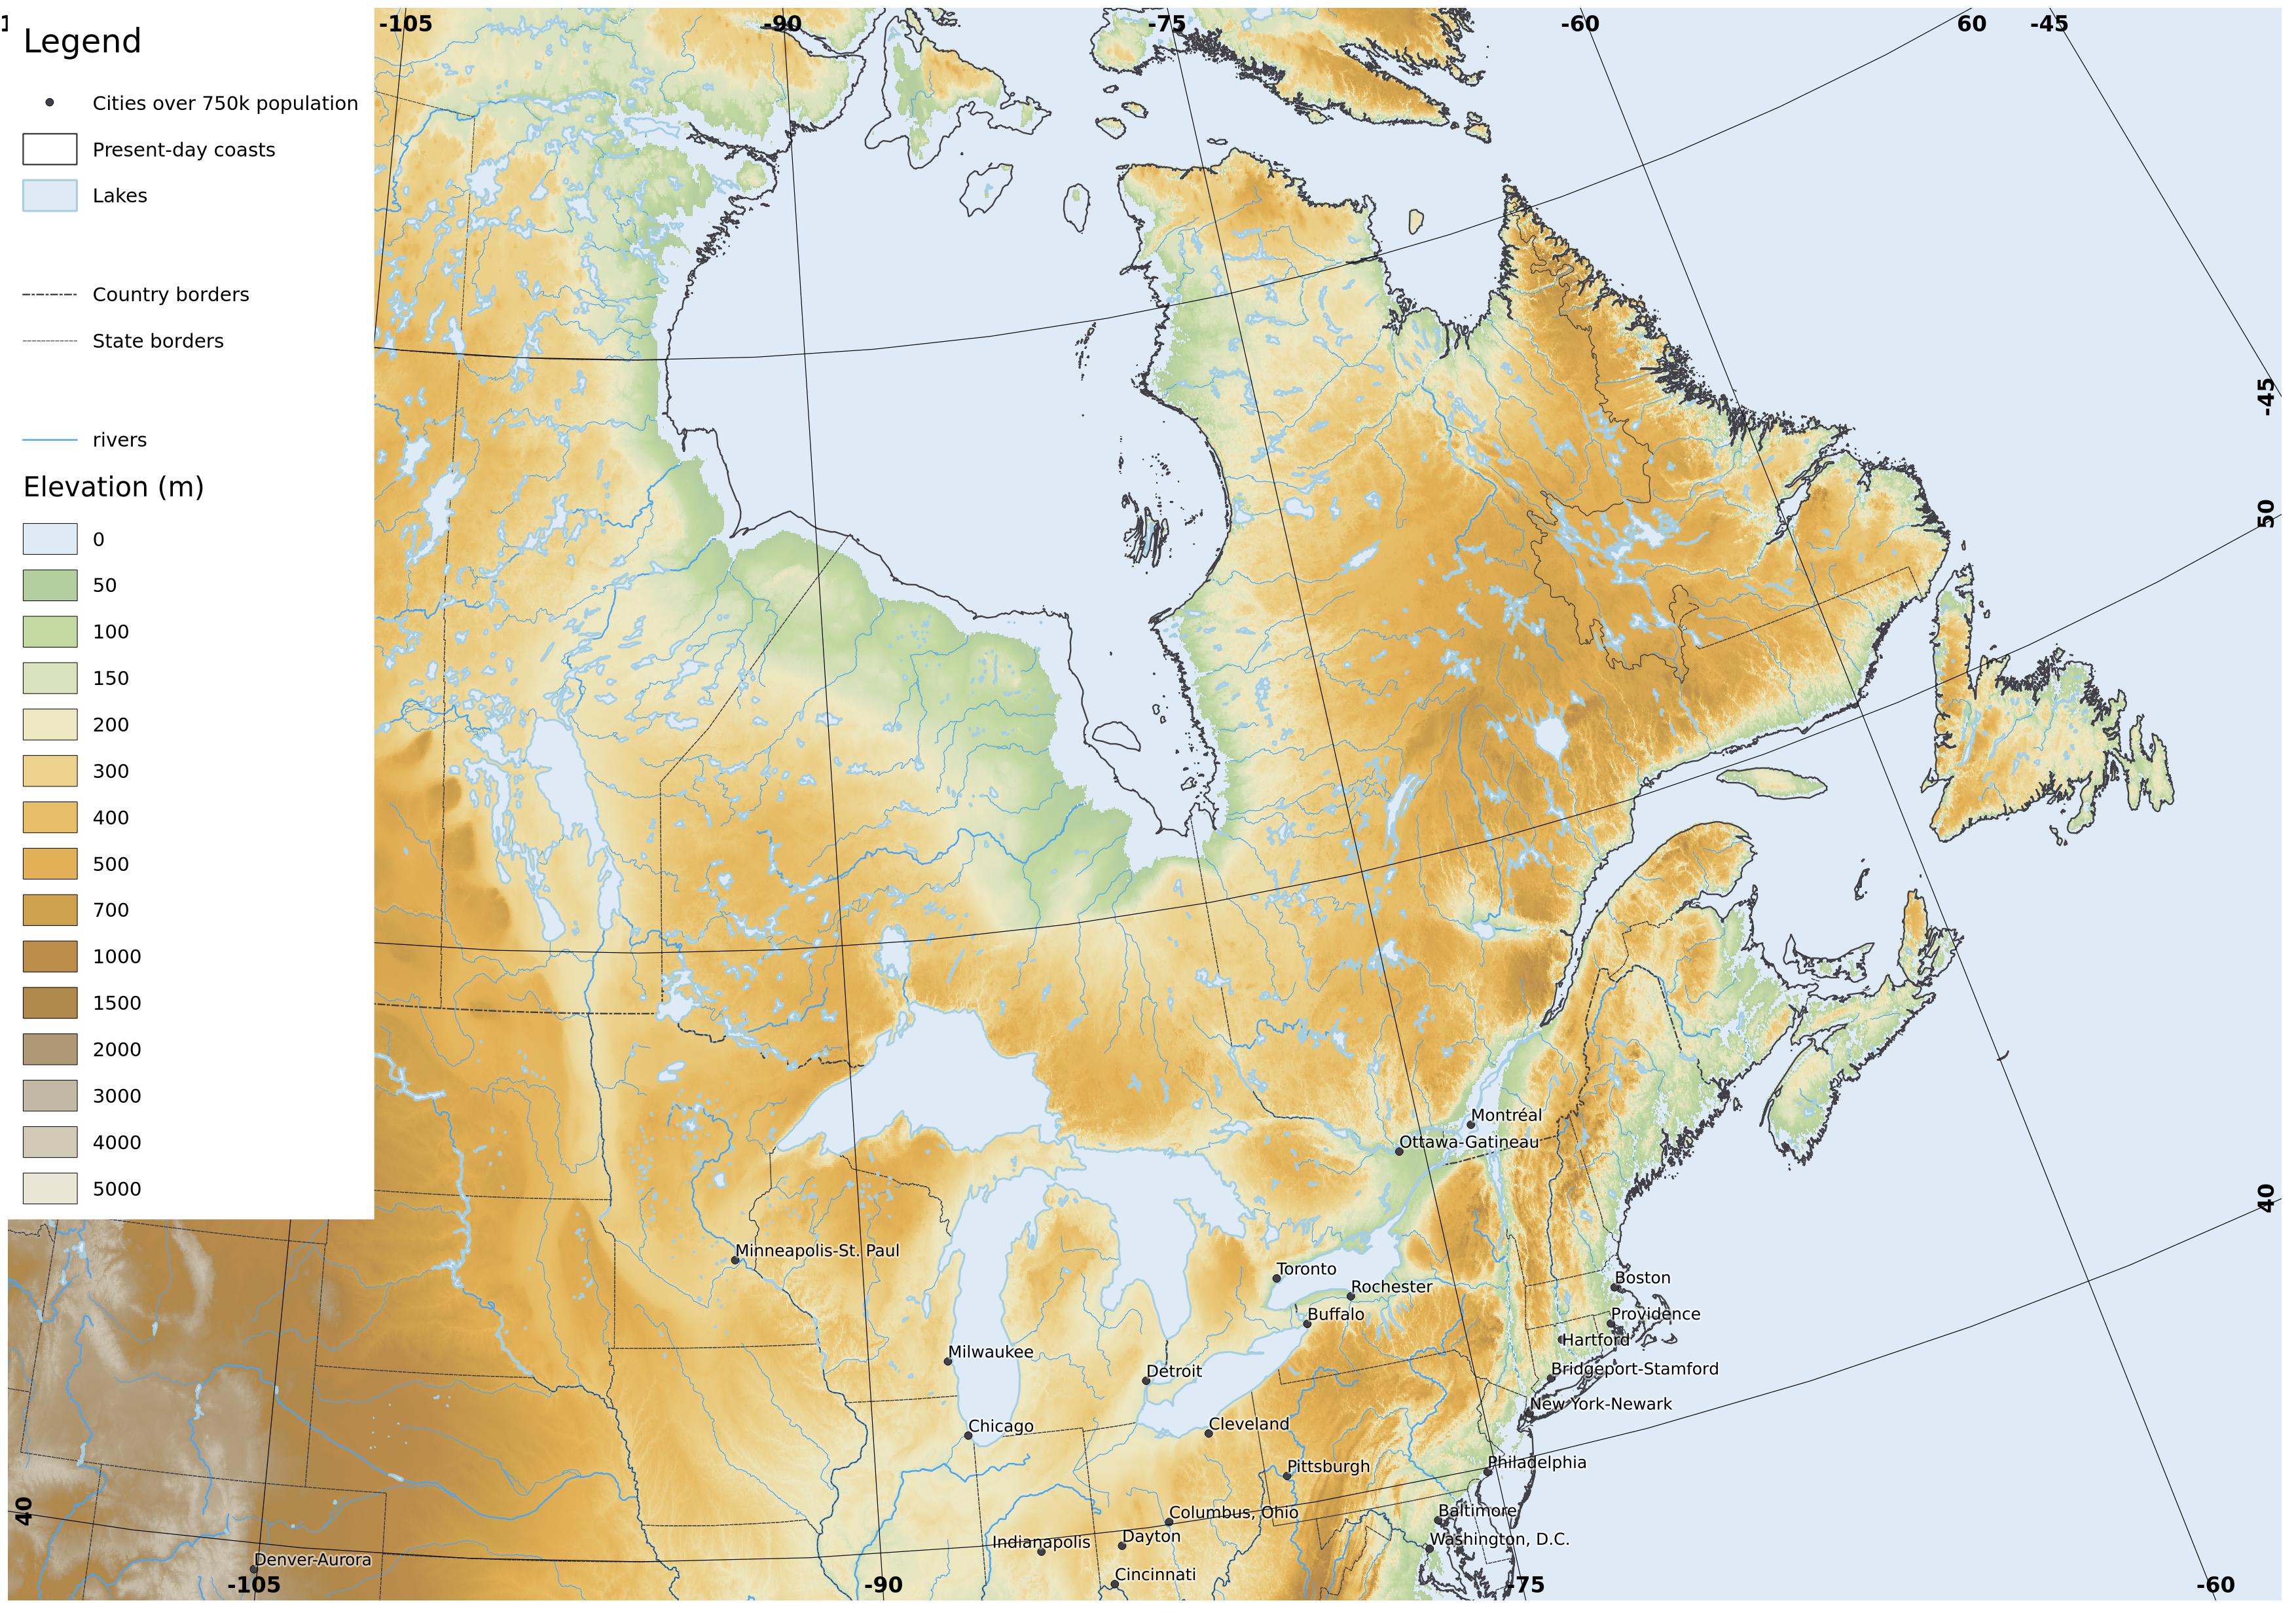
I thought it worthwhile however to make my own maps of this world in QGIS. I have used the CleanTopo2 digital elevation model. For reference I mark present day coastlines and borders from the Global Self-consistent, Hierarchical, High-resolution Geography Database (NOAA) and the locations of major urban areas >750k inhabitants, from Nordpil (based on data from the UN Population Division).
I have used an Equidistant Conic Projection for the continental scale ones, and Albers Equal Area Projection for the more close-up ones. Most of the maps have a scale of 1:30 million if printed at A4. I link to full-size JPGs of the maps at my own website.
I have not included Antarctica so far, I may do so later if I get hold of a decent bedrock DEM and make some reasonable assumptions about remnant ice sheets at this point.
He is now looking for stories for a shared-world anthology set in the same world as Star's Reach, the Meriga Project. In the 25th century, the Greenland ice cap and most of Antarctic ice have melted leaving sea level 50m higher than at present. It is possible to view the effect of this at websites like flood.firetree.net.
I thought it worthwhile however to make my own maps of this world in QGIS. I have used the CleanTopo2 digital elevation model. For reference I mark present day coastlines and borders from the Global Self-consistent, Hierarchical, High-resolution Geography Database (NOAA) and the locations of major urban areas >750k inhabitants, from Nordpil (based on data from the UN Population Division).
I have used an Equidistant Conic Projection for the continental scale ones, and Albers Equal Area Projection for the more close-up ones. Most of the maps have a scale of 1:30 million if printed at A4. I link to full-size JPGs of the maps at my own website.
I have not included Antarctica so far, I may do so later if I get hold of a decent bedrock DEM and make some reasonable assumptions about remnant ice sheets at this point.
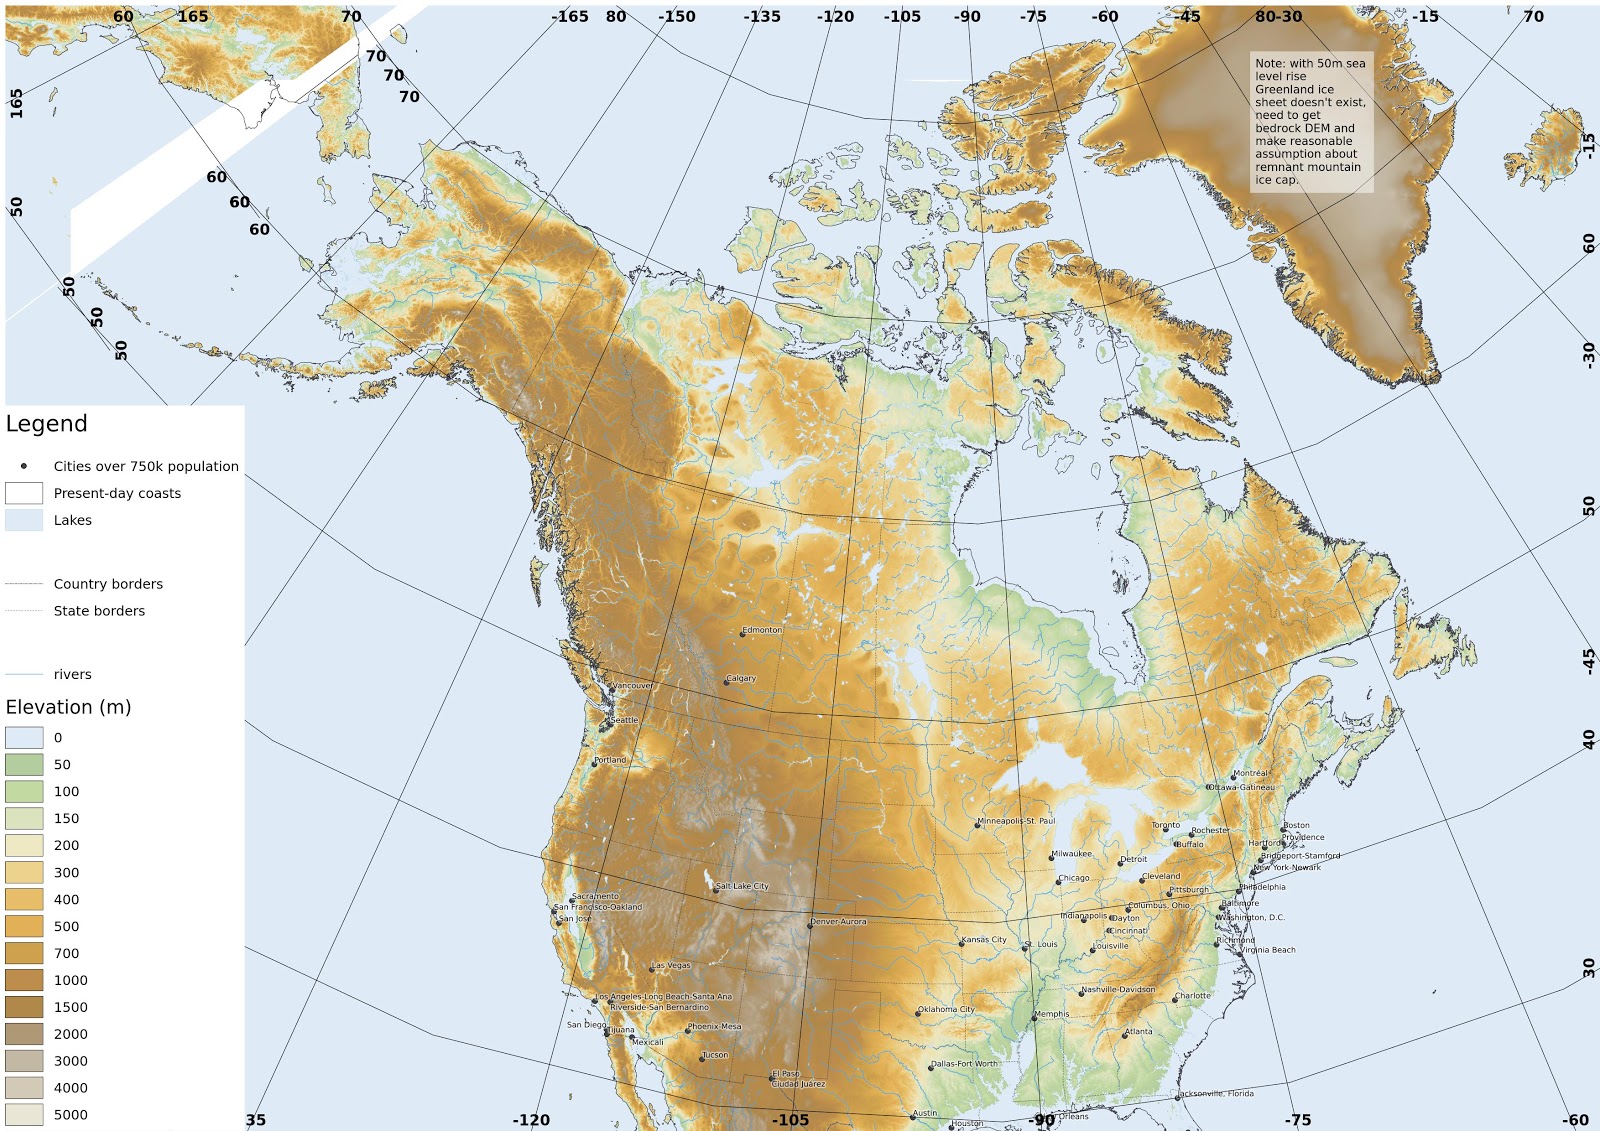 |
| The northern part of N America, comprising present-day USA, Canada and Greenland. full-size version |
 |
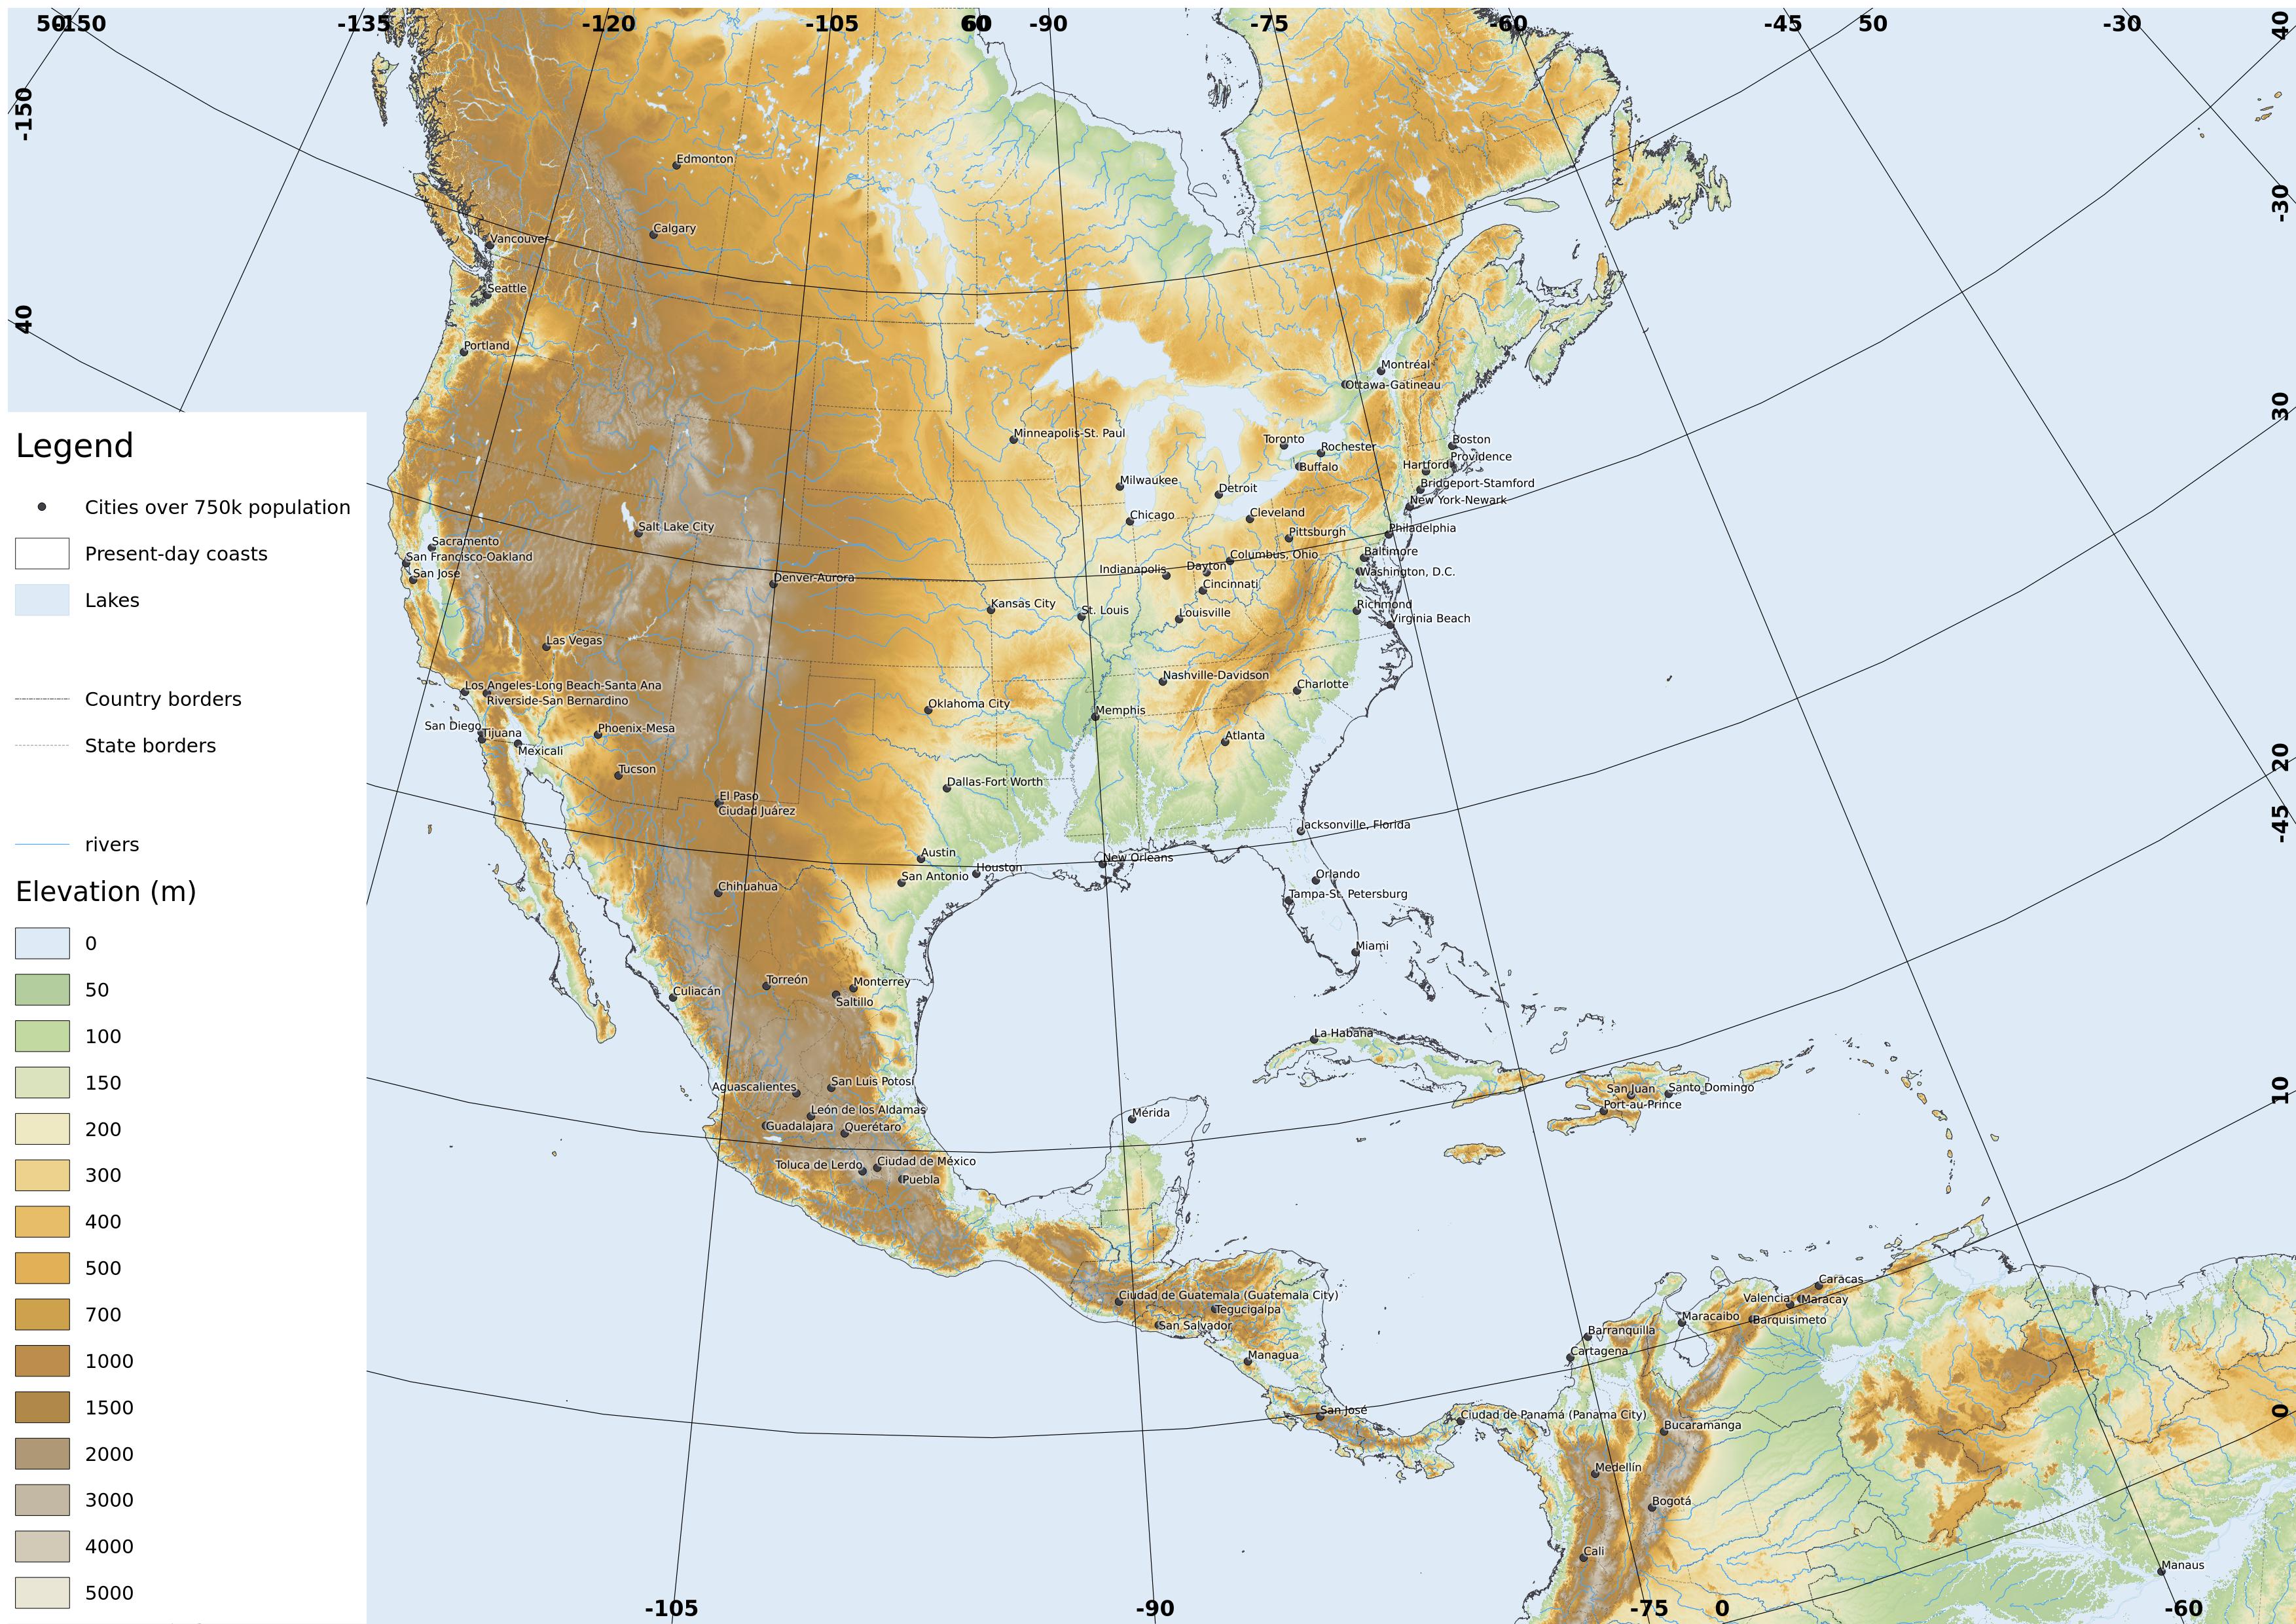
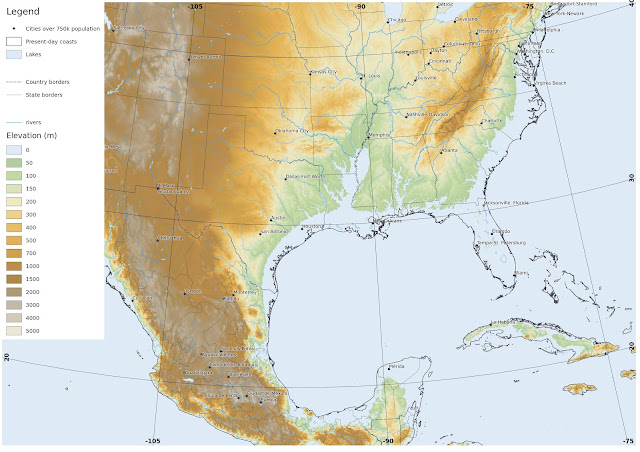
| The former USA and Central America. full-size version |
 |
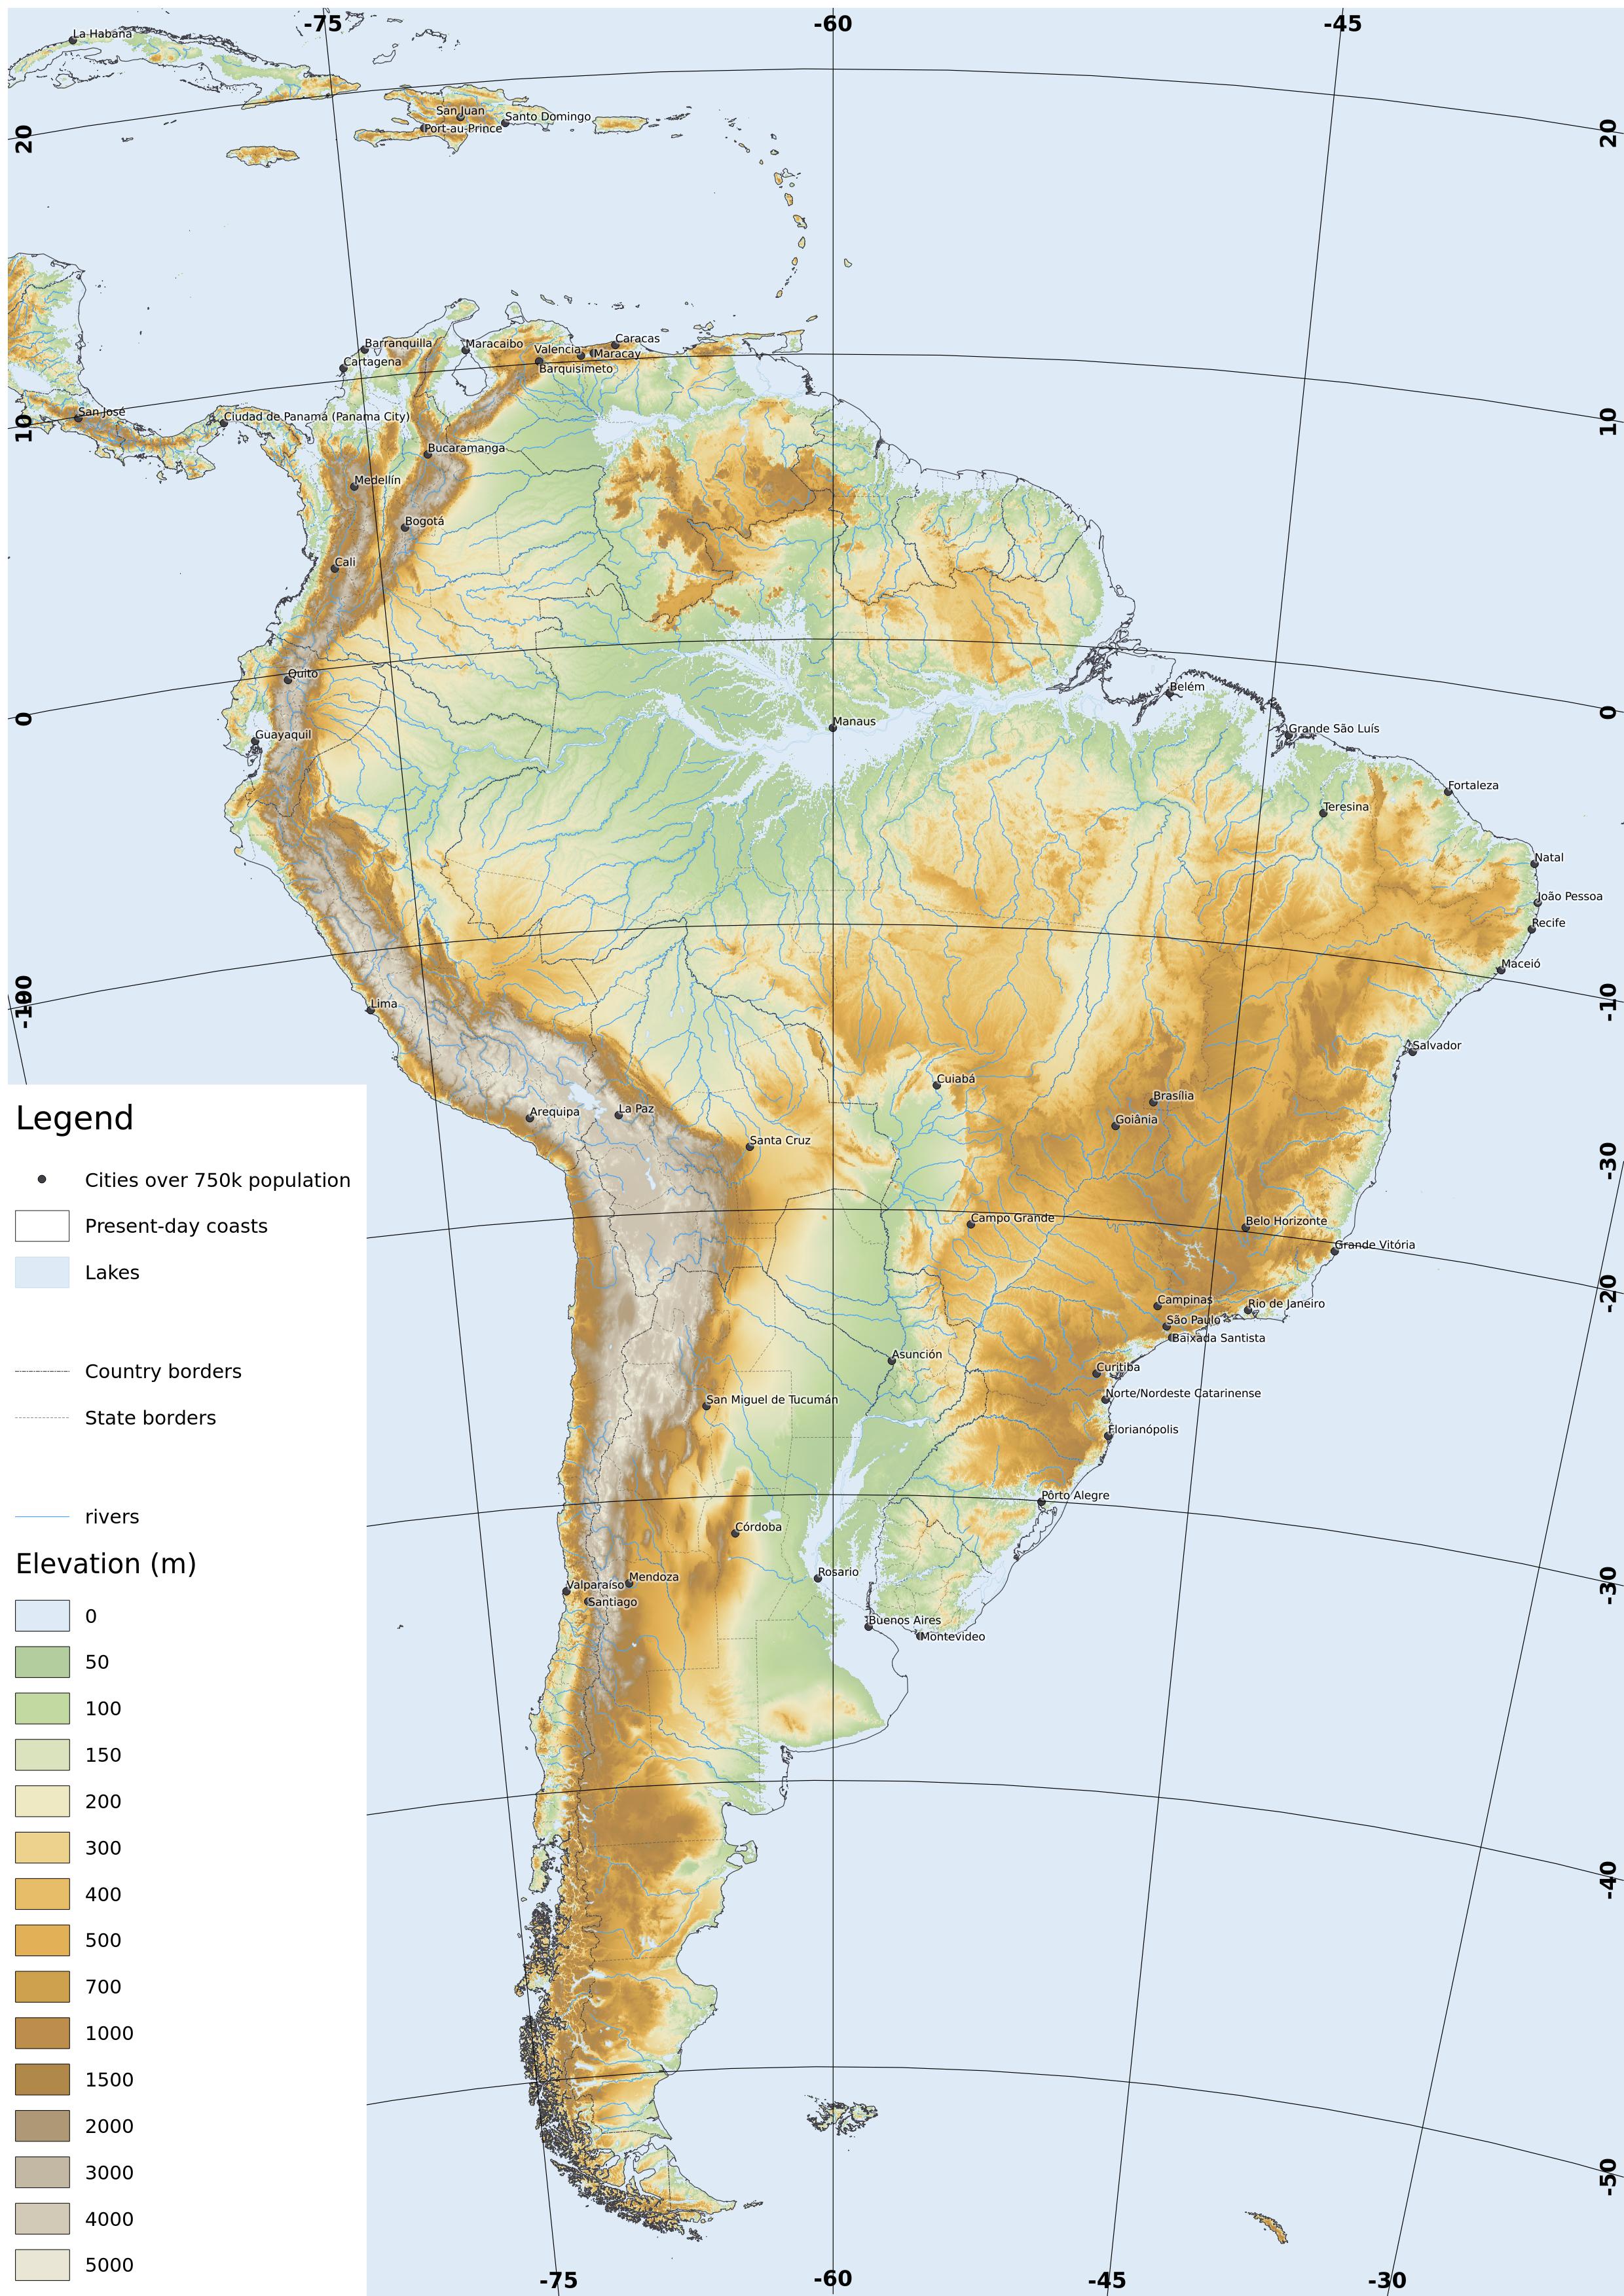
| South America. full-size version |
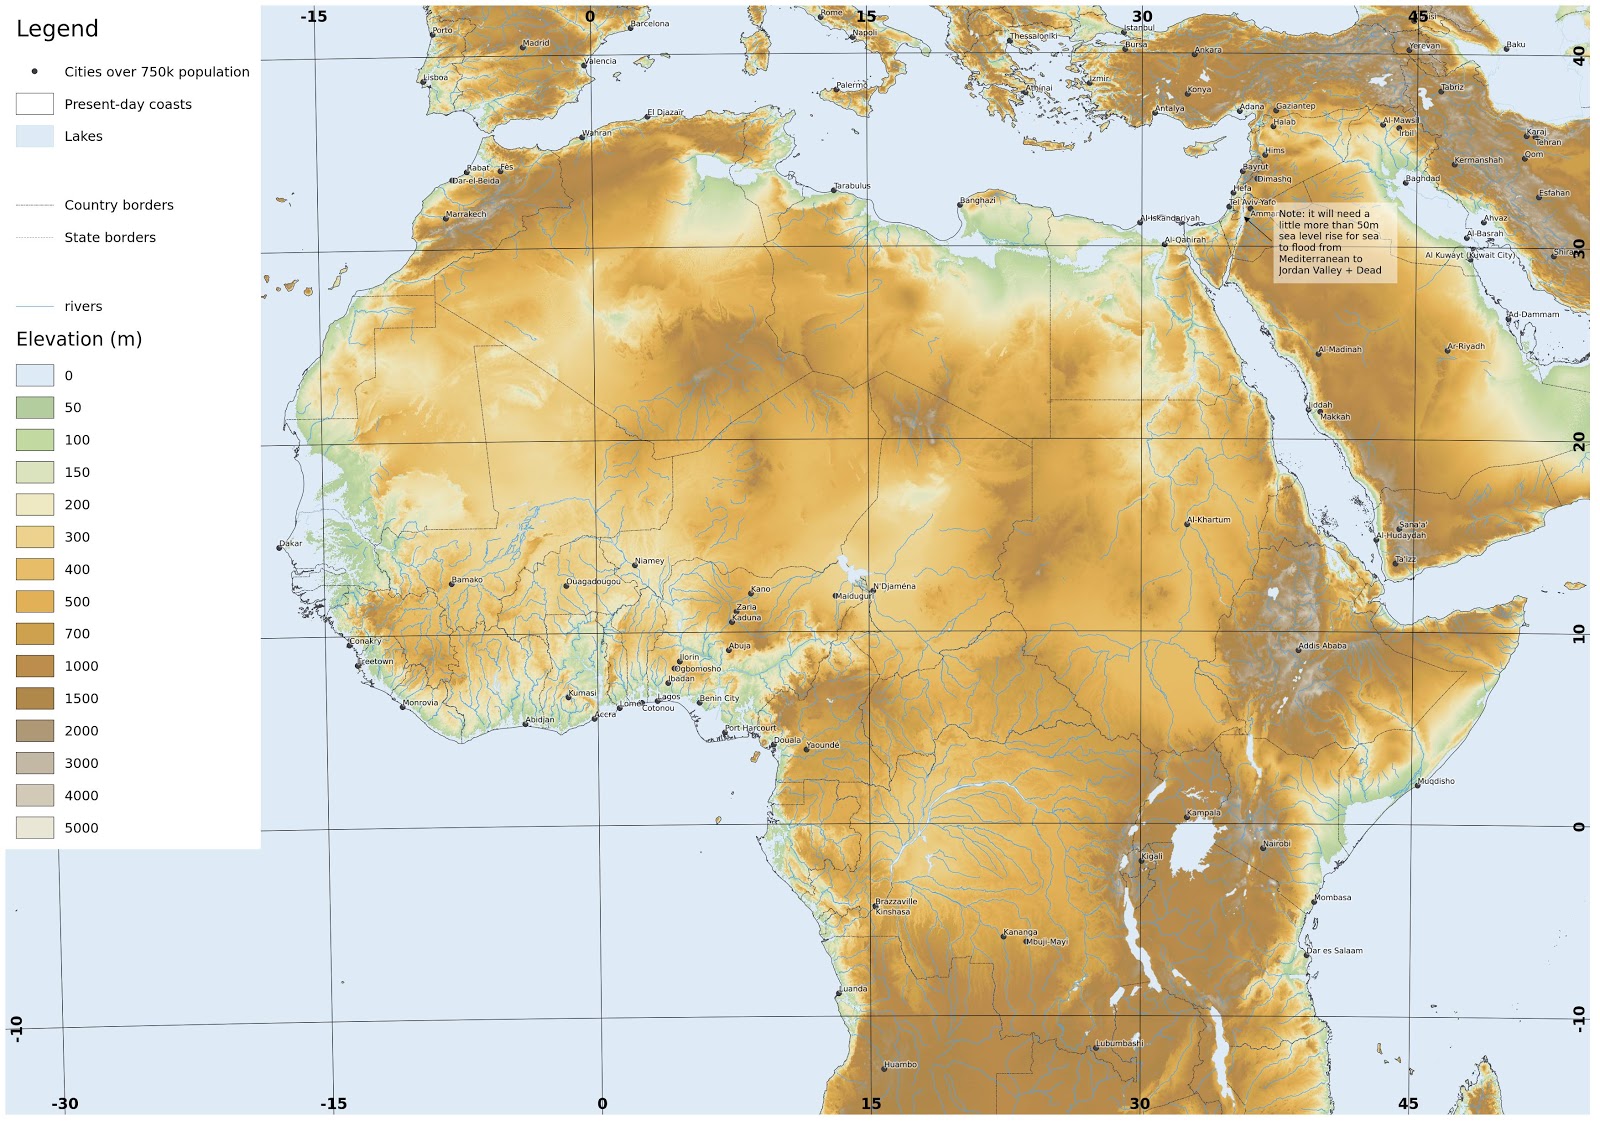 |
| North Africa. The Jordan valley and Dead Sea basin is not in fact flooded, since 50m sea level rise is not enough to make the connection from the Mediterranean. full-size version |
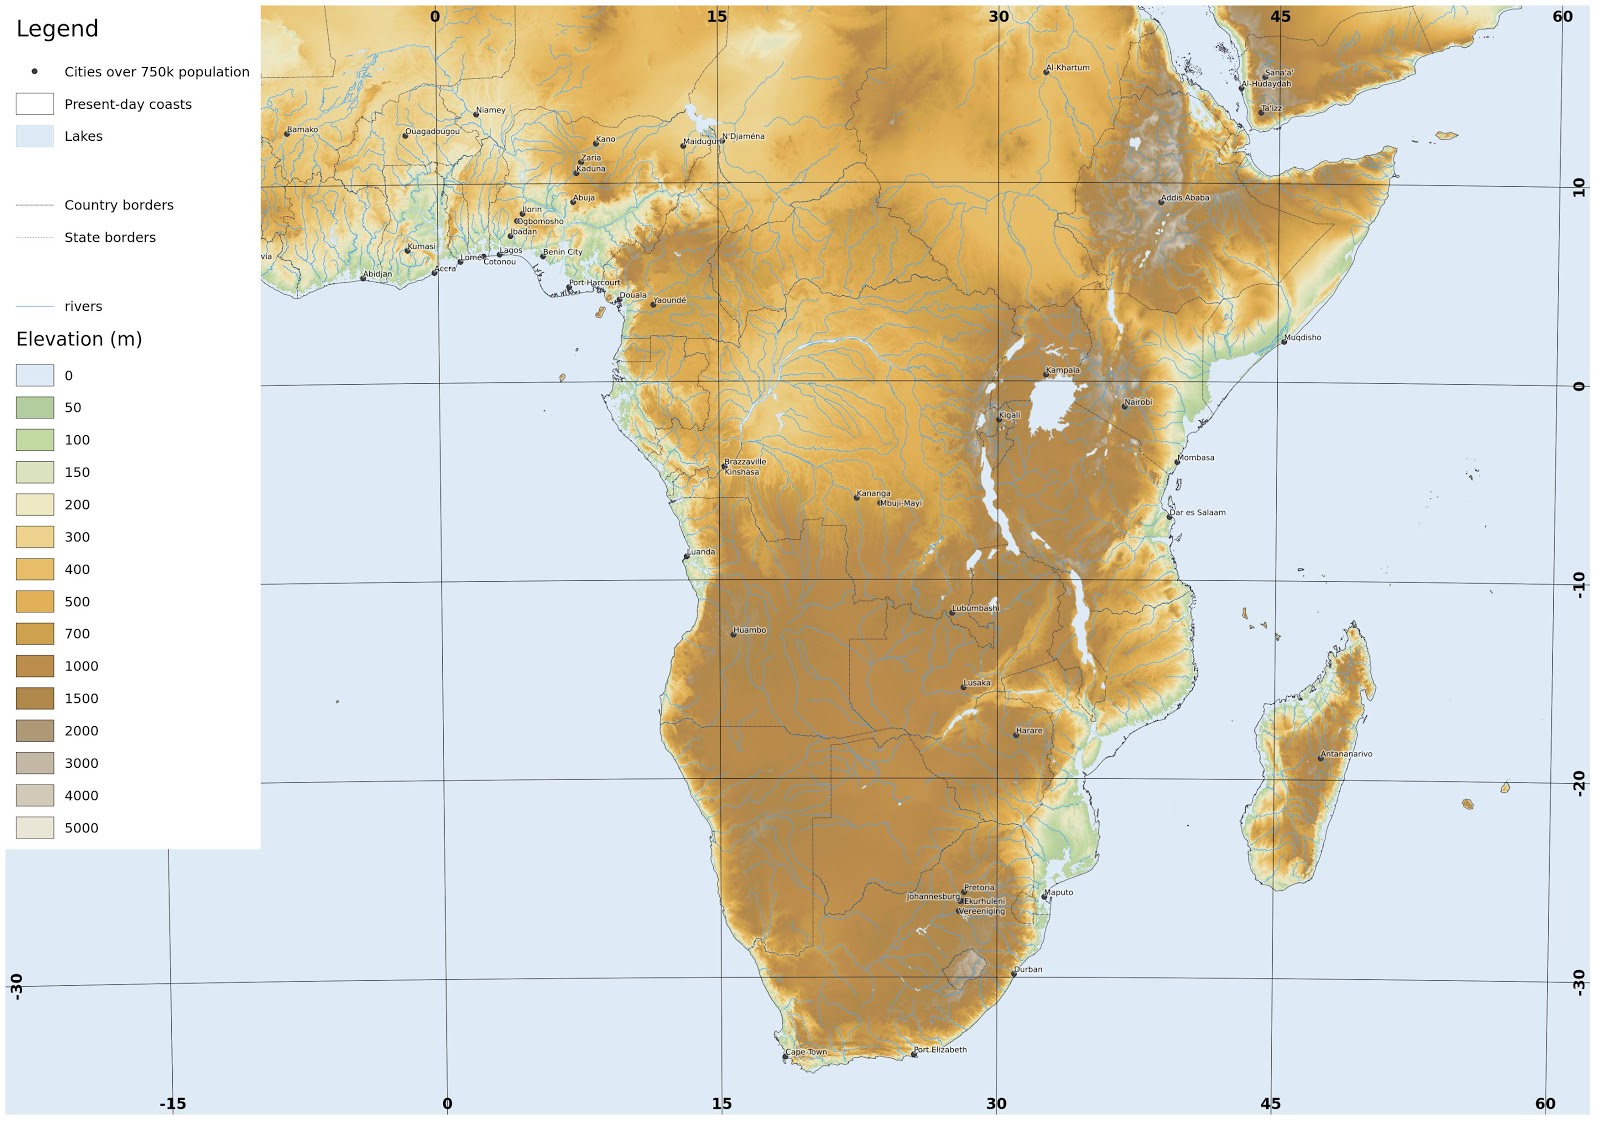 |
| Southern Africa. full-size version |
 |
| Northern Asia. full-size version |
 |
| SE Asia. full-size version |
 |
| SW Asia. full-size version |
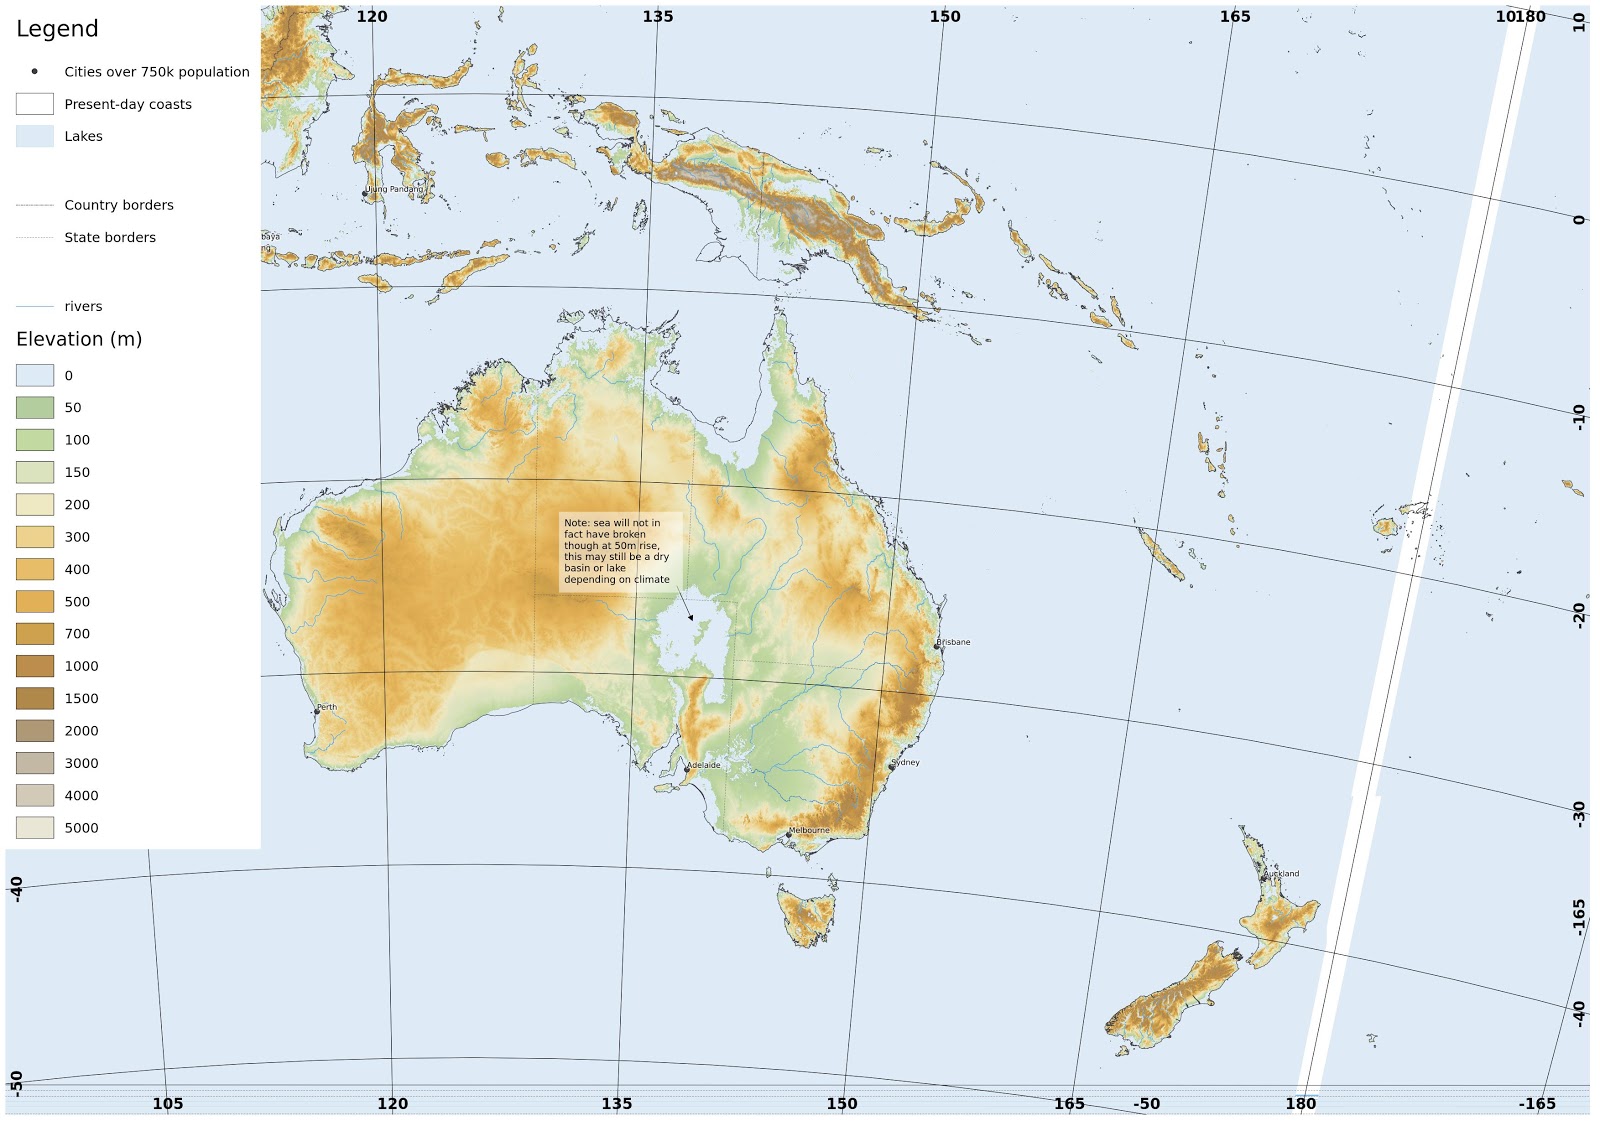 |
| Australasia. Note the sea does not actually flood the Lake Eyre basin in Australia (link). full-size version |
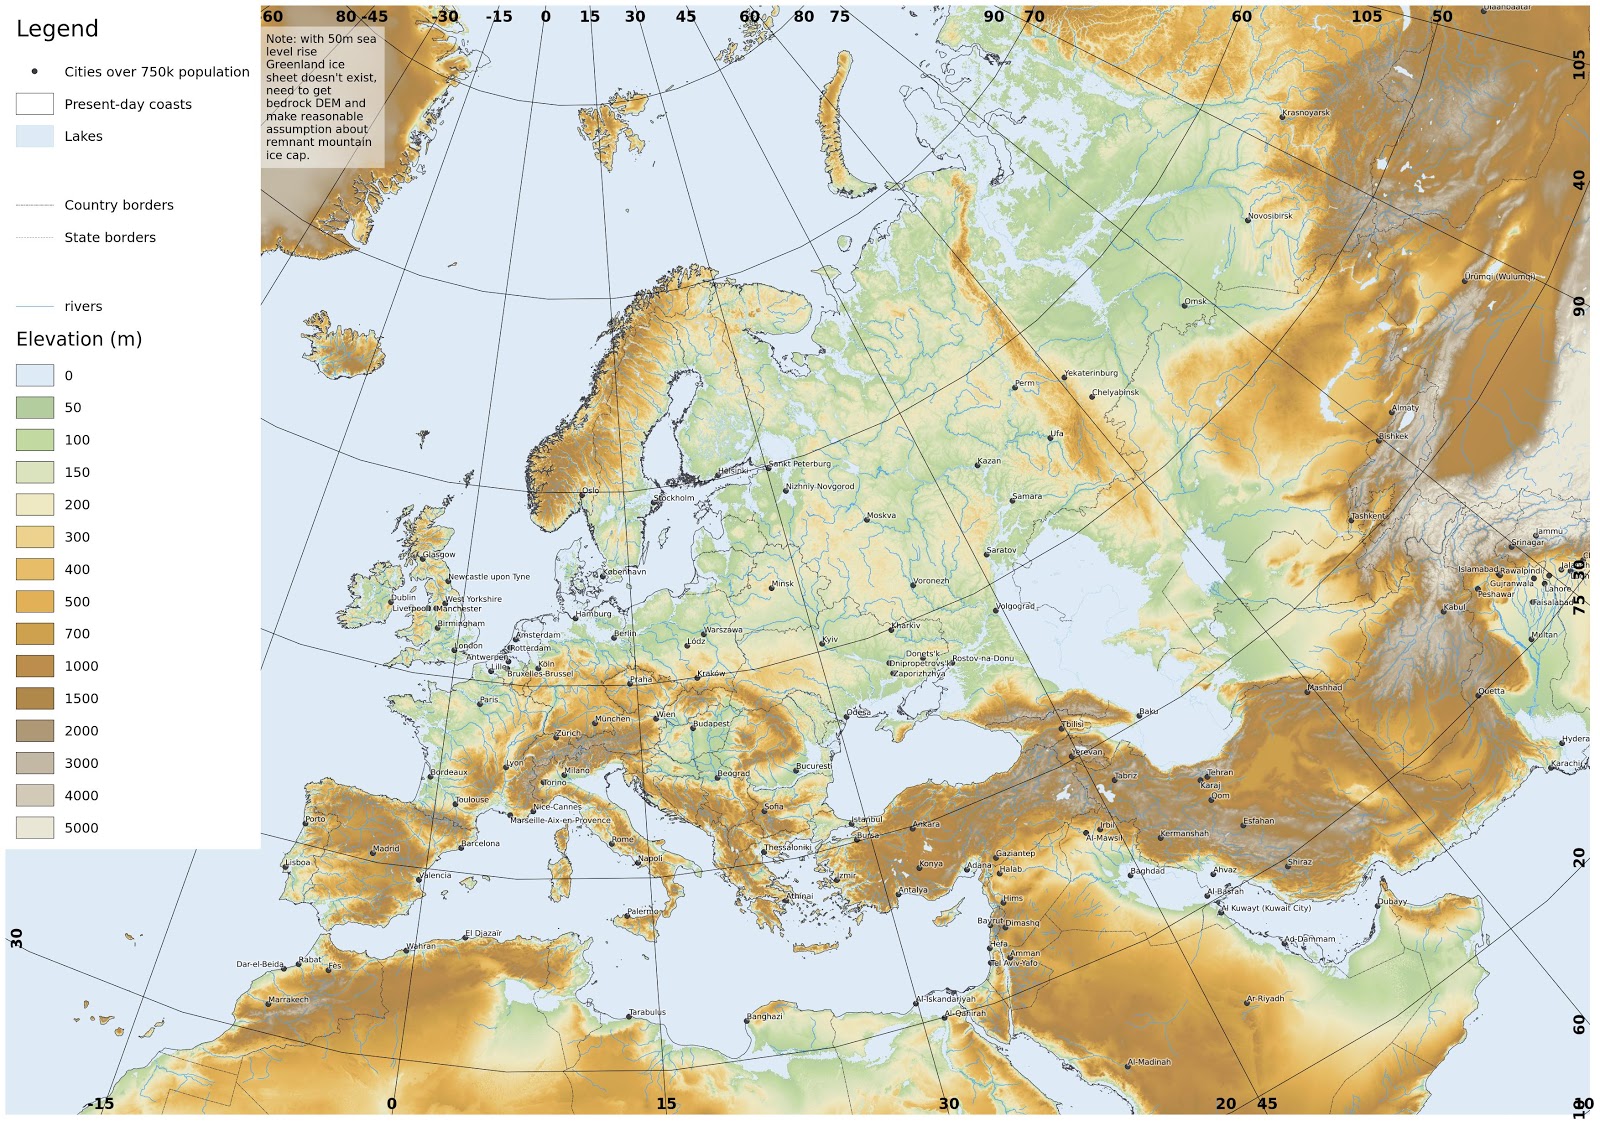 |
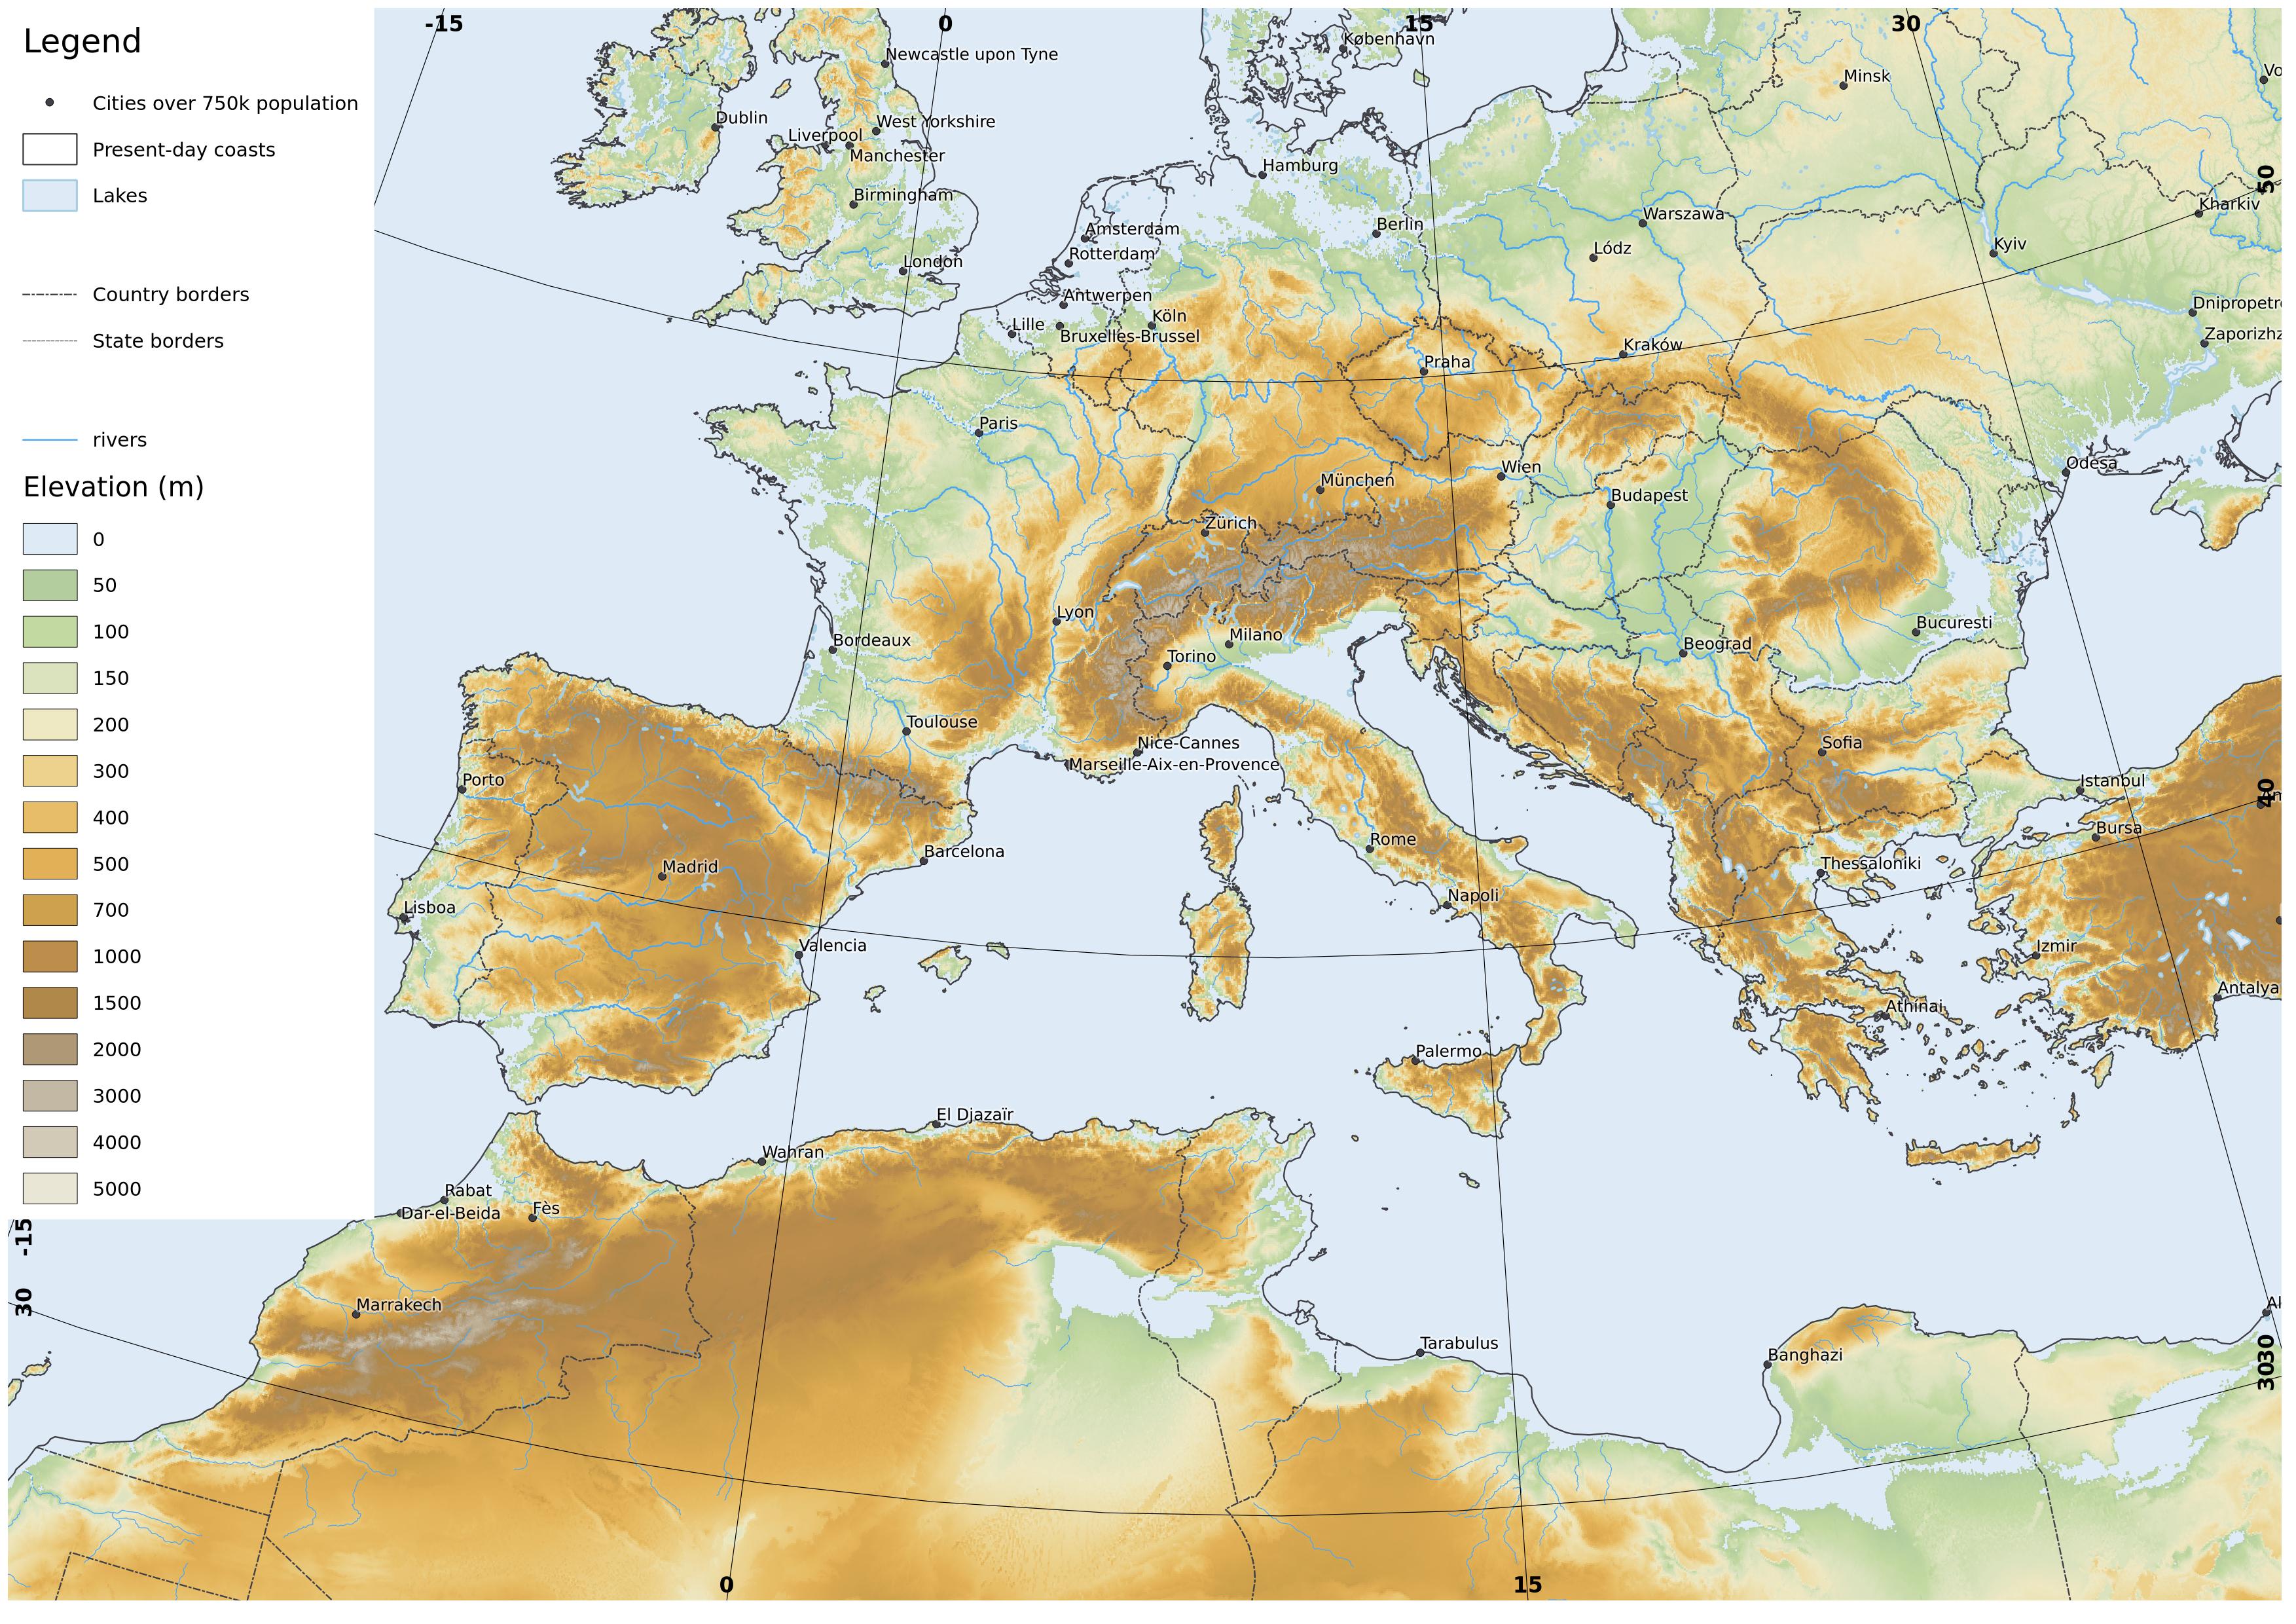
| Europe. The Jordan valley and Dead Sea basin is not in fact flooded, since 50m sea level rise is not enough to make the connection from the Mediterranean. full-size version |
 |
| A closer view of eastern Canada and NE USA. This has a different projection which if I remember rightly was Albers Equal Area Conic. full-size version |
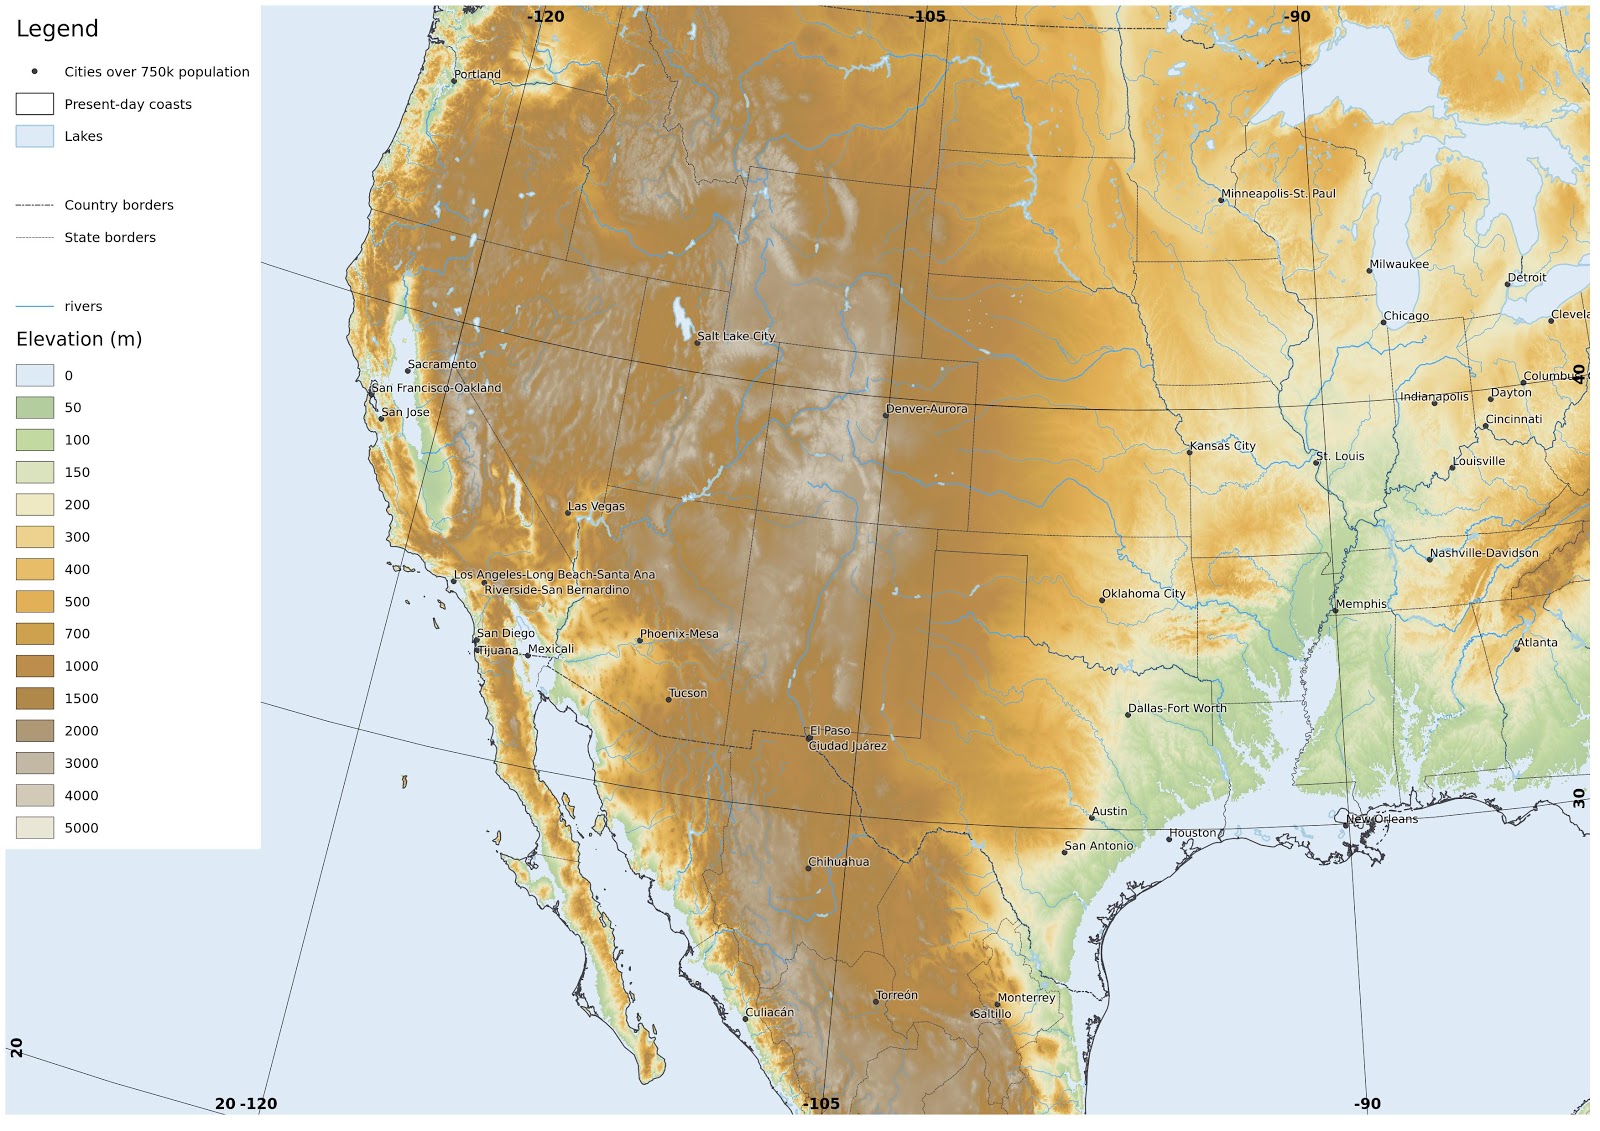 |
| SW USA. full-size version |
 |
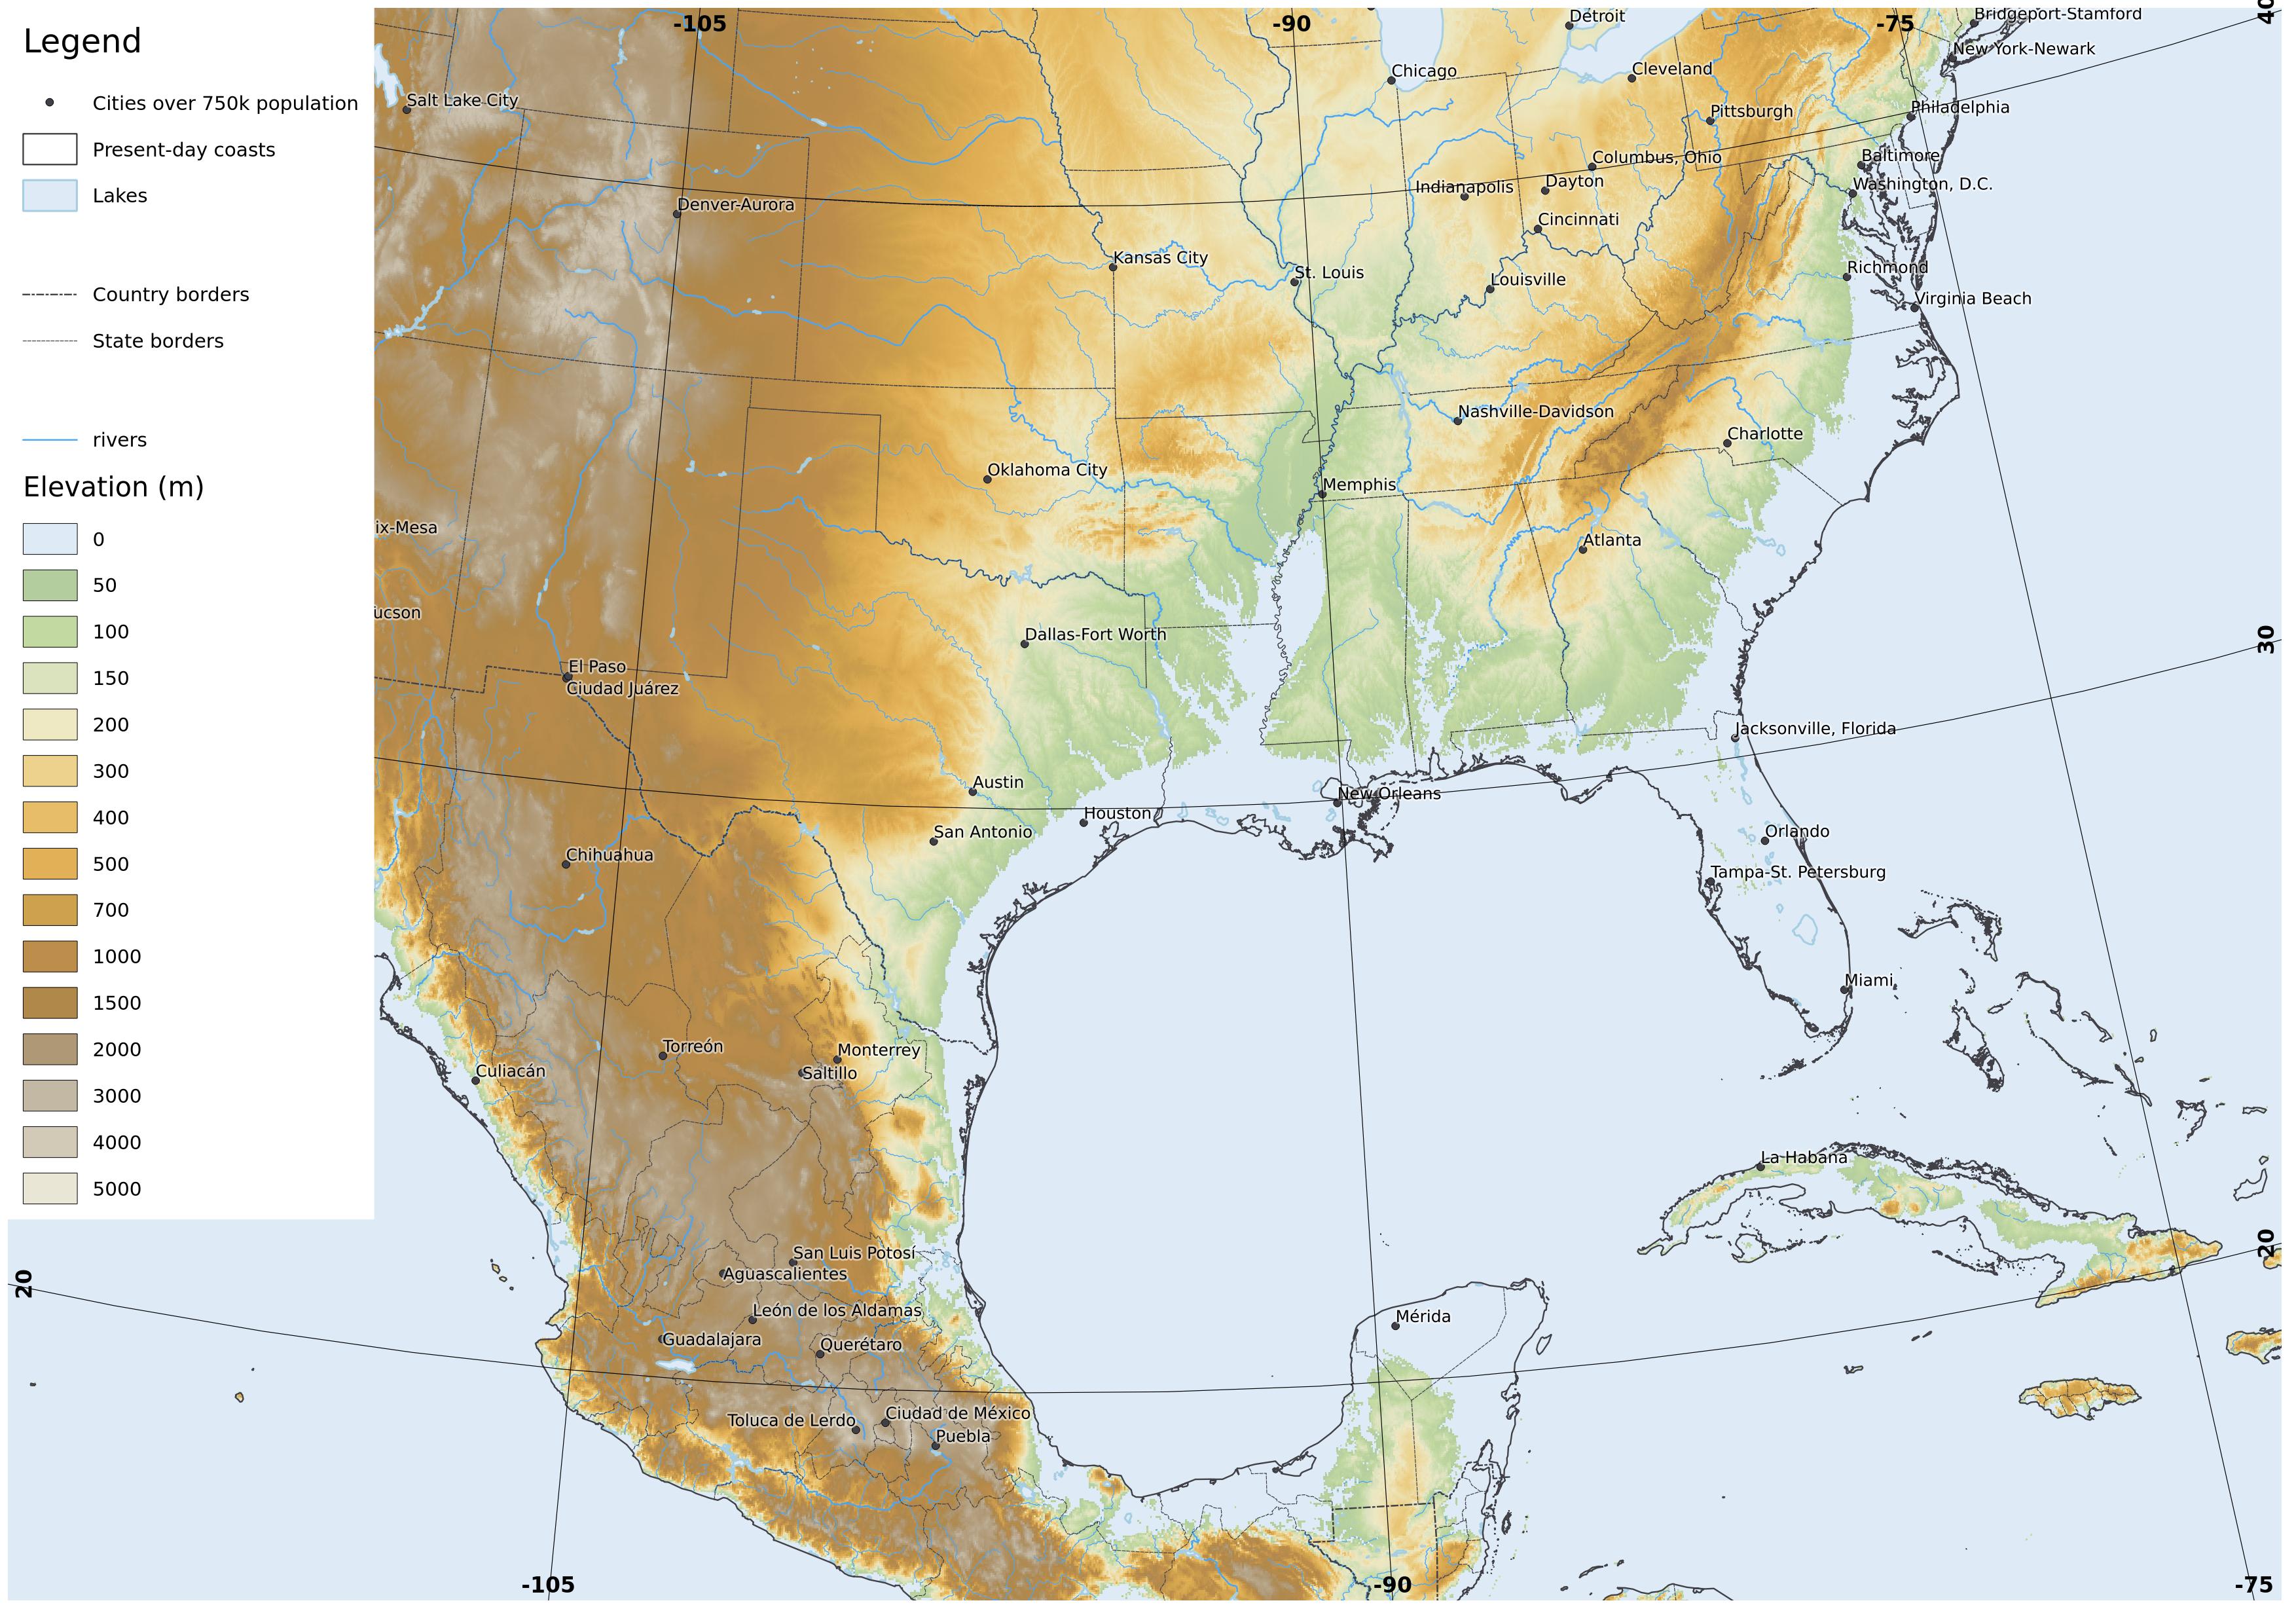
| SE USA. full-size version |
 |
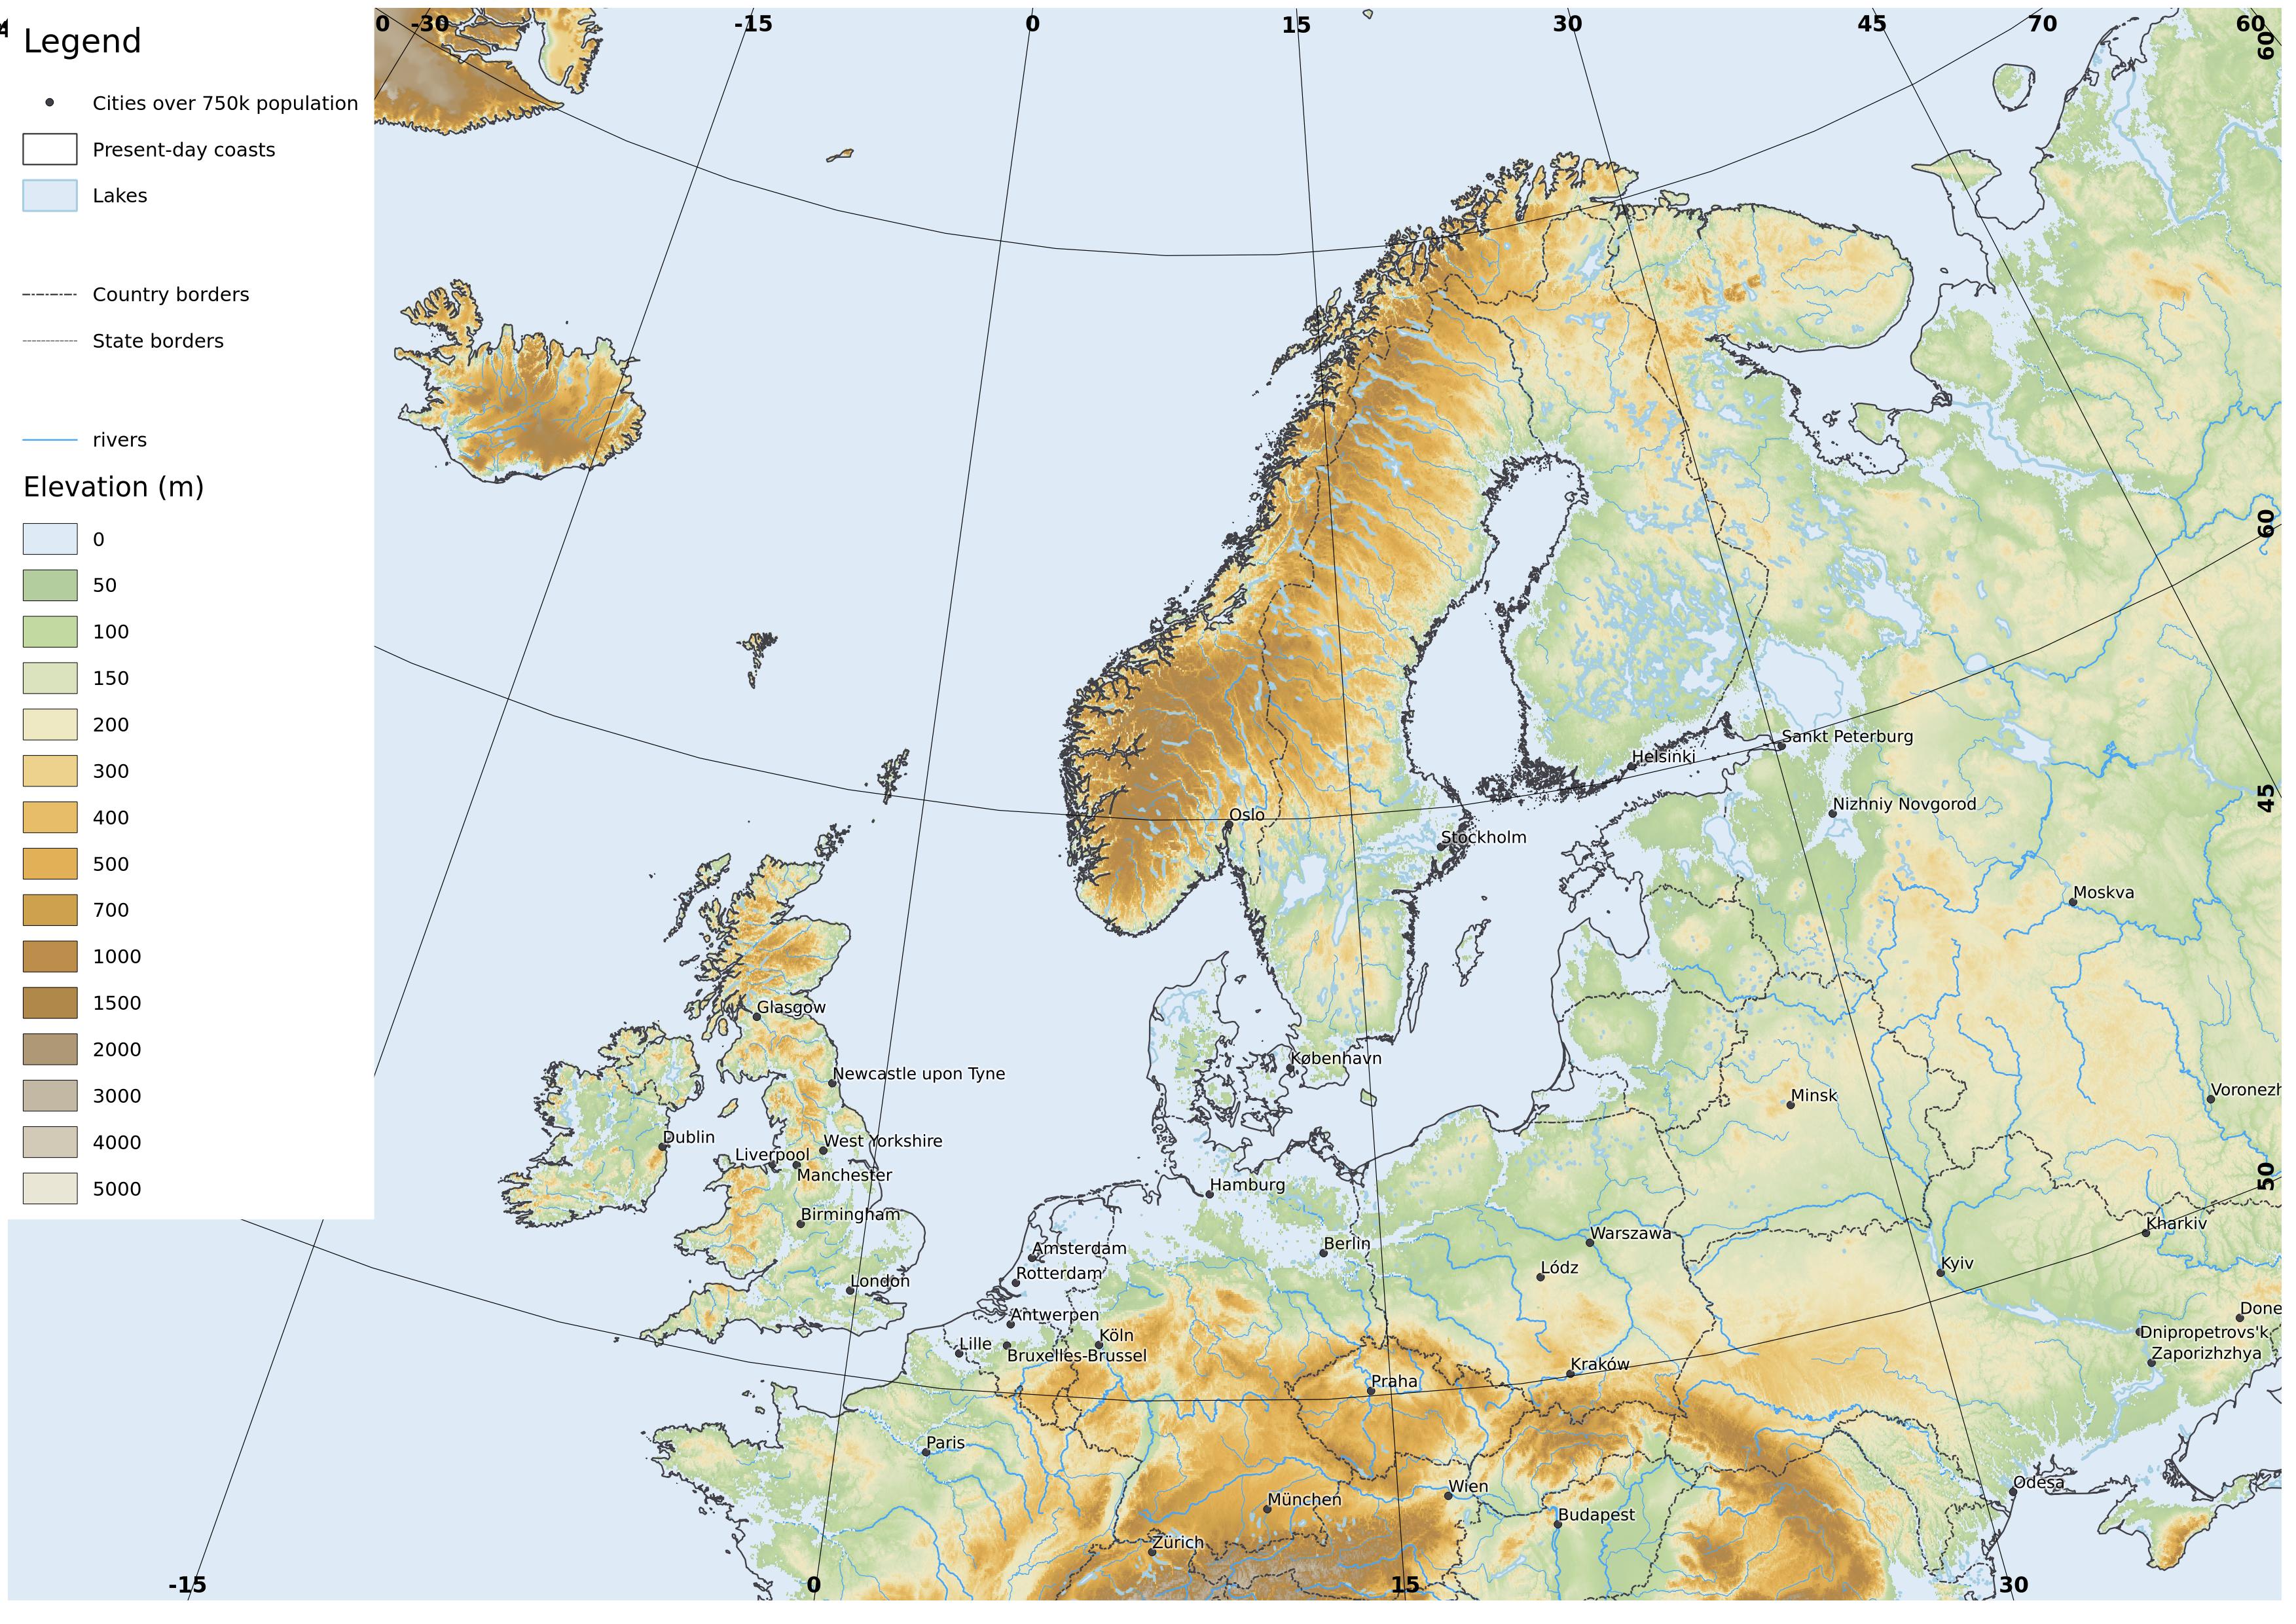
| N Europe. full-size version |
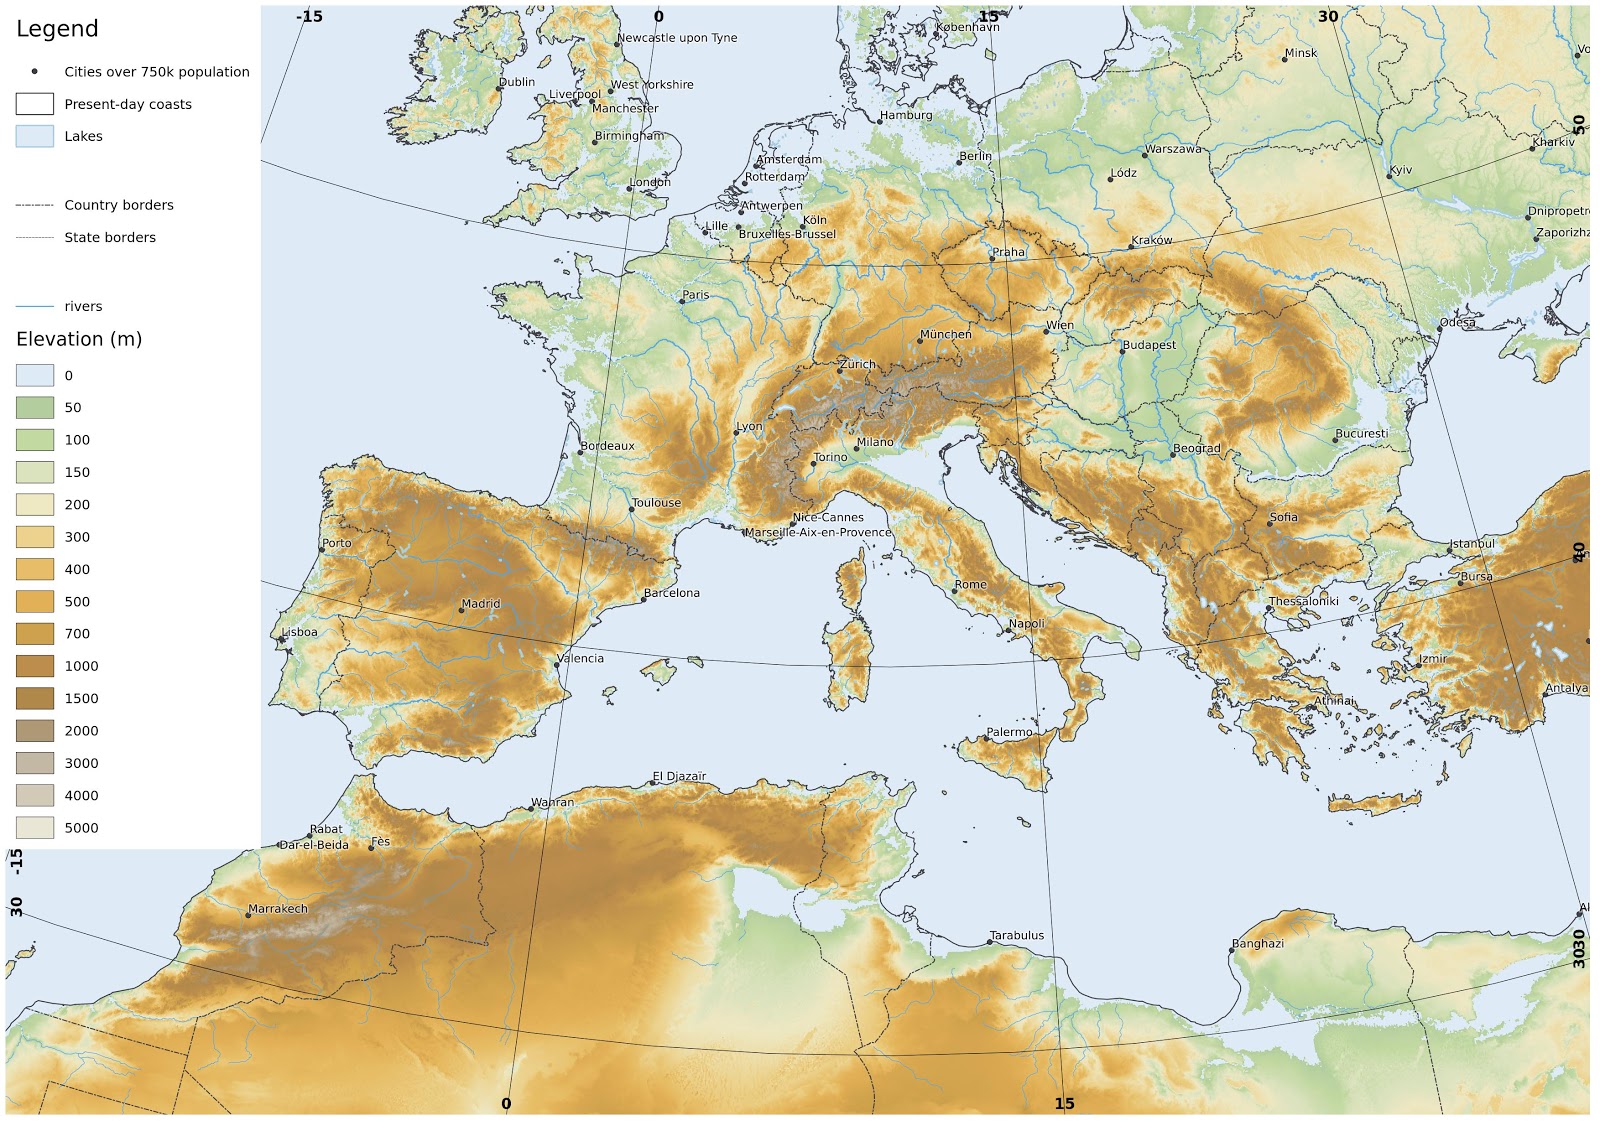 |
| S Europe. full-size version |
Ebrenn y'n nos - mis-Gwynngala 2015
Apologies I haven't got round to recording this month's Ebrenn y'n Nos - various things have got in the way and I haven't had the chance to do a high-quality audio recording. Here is the text of it.
Dydh da. Ottomma rann nowydh kevres “Ebrenn y'n nos” mis-Gwynngala.
Yma an dydhyow orth aga berrhe ha'n nosow dhe hirhe dres an mis ma. Dhe'n 23a mis-Gwynngala, an kehysnos yw, pan vydh hirder an nos kehaval orth hirder an jydh.
Yma an trihorn hav hwath y'n ebrenn wosa hi dhe dewlhe, y hwra gortos ena bys dhe vis-Kevardhu drefenn kyn hwra an sterennow sevel hag esedha a-varra hag an seson dhe vos yn-rag, amser an howlsedhes a dheuth ha bos a-varra keffrys.
Yma Sadorn owth esedha a-varra, mes hwath gweladow yw yn Soth-West y'n gorthugher.
Dhe'n pymthegves mis-Est a wrug Gwener mos ynter an howl ha'n norvys. Nyns o an alinyans poran drefenn bos nebes ynklinyans dhe resegvaow an planetys. Ytho, ny wrug Gwener treustremena a-rag enep an howl y honan. A-varra an hav ma yth esa Gwener yn ebrenn gorthugher, y'n mis ma hi a wra dasomdhiskwedhes y'n ebrenn bora avel Borlewen. Erbynn diwedh mis-Gwynngala, bydh planetys Meurth ha Yow yn ebrenn bora kyns an howldrevel. Meurth yw pell diworth an norvys a-lemmyn ha nebes gwann y splannder, saw braster 1.8. An skeul 'braster' po magnitude yw koynt drefenn bos niverow byghanna dhe sterennow moy aga splannnder. Yma an ster gwanna neb yw gweladow dre dhewlagas nooth braster 6, an splanna sterenn Sirius yw -1.6 ha'n loor leun ogas ha -12.
Yow yw pella diworthyn es Meurth mes marthus brassa ha splanna y'n ebrenn. An dhew anedha a wra bos gweladow yn ta gwaynten nessa.
An loor yw dhe'n kwartron diwettha 5ves mis Gwynngala, yma loor nowydh dhe'n 13ves, kwartron kynsa 21a ha loor leun dhe'n 28ves. Loor leun an mis ma, yw gelwys avel 'gorloor'. An reson yw, yma an loor orth hy savla nessa dhe'n norvys dhe'n keth termyn usi hi leun. Ytho, an loor yw nebes brassa ha splanna y'n ebrenn es yw usadow, mes an difrans yw byghan yn hwir.
Mes kyns bora dhe'n 28ves mis-Gwynngala, y fydh difyk an loor. An loor a wra tremena a-ji skeus an nor, ha dos ha bos tewl ha rudh, ny vydh golowys marnas dre ayrgylgh an nor. An loor a wra tremena yn skeus an nor (yn stroth – an umbra) ynter 0207 ha 0527 (amser hav Predennek) hag y fydh yn skeus kowal ynter 0311 ha 0423. An loor vydh gweladow yn ebrenn soth-west yn termyn an difyk.
Ni a dhyskas an hav ma a-dro dhe'n efanvos New Horizons, hag ev dhe dresnija Pluton. Ev a wra spedya yn efan down lemmyn mes hwath a wra dannvon data dhe'n norvys a wrug ev kuntell a-dro dhe Bluton. Iskargans an data yw pur lent, ogas ha 1 kilobyt pub eylenn. Dhe'n kevradh na, rann Radyo an Gernewegva a wrussa iskarga yn pymp dydh. New Horizons a wra dresnija taklenn grogys Kuiper 2014 MU69 dhe'n Dy' Kalann 2019.
 |
| Difyk an loor 3a mis-Meurth 2007, skeusenn gwrys genev. |
Ni a dhyskas an hav ma a-dro dhe'n efanvos New Horizons, hag ev dhe dresnija Pluton. Ev a wra spedya yn efan down lemmyn mes hwath a wra dannvon data dhe'n norvys a wrug ev kuntell a-dro dhe Bluton. Iskargans an data yw pur lent, ogas ha 1 kilobyt pub eylenn. Dhe'n kevradh na, rann Radyo an Gernewegva a wrussa iskarga yn pymp dydh. New Horizons a wra dresnija taklenn grogys Kuiper 2014 MU69 dhe'n Dy' Kalann 2019.
An efanvos DAWN usi ow mos yn resegva a-dro dhe Ceres, an brassa planetik y'n Penngrogys, a dhiskudhas menydh ynyal 6 km y ughelder war y enep.
http://astronomynow.com/2015/08/08/ceres-mysterious-bright-spots-and-4-mile-tall-pyramidal-mountain-in-3-d/http://astronomynow.com/2015/08/25/dawn-sends-sharper-scenes-from-dwarf-planet-ceres/
Curiosity, an 'rosyell' war enep Meurth a wrug dannvon omskeusenn (selfie)dhe'n norvys. Ev a usyas y bregh robot avel gwelenomskeusenn.NASA a wrug gwrias an imajys war-barth bys dhe'n omskeusennnowydh. Curiosity re wrug lywya moy ages 11 km a-wosa ev dhe dira war Meurth yn 2012. http://astronomynow.com/2015/08/23/mountain-climbing-mars-rover-sends-back-low-angle-selfie/
An komet 67P/Churyumov-Gerasimenko a wrug drehedhes y savle ogassa dhe'n howl yn y resegva 13ves mis-Est. http://astronomynow.com/2015/08/14/rosetta-studies-comet-67p-at-perihelion/http://astronomynow.com/2015/08/03/philaes-descent-to-comet-67p/Yma an komet ow kelli 300kgo dhowr ha 1000km doust pub eylenn. Kyn hwrug an tirell Philaedifuna yn mis-Metheven, ha dannvon sinell dhe'n resegvell, ny wrug an kestav pesya, saw nebes amserow a-wosa rag termyn berr. http://astronomynow.com/2015/07/11/new-contact-with-intractable-comet-lander/http://rosetta.esa.int
My a wayt i dhe glywes diworto arta. Bys nessa prys, Duw genes rag an mis ma.
A Python based utility to examine geotagged photos in Landsat
I have been wondering about how it might be possible to automatically decide on land cover classification rules, as I mentioned in previous posts.
I realised the first step was to create a way of using a list of the images of the ground reference points and their coordinates, to examine the images together with remote-sensed images.
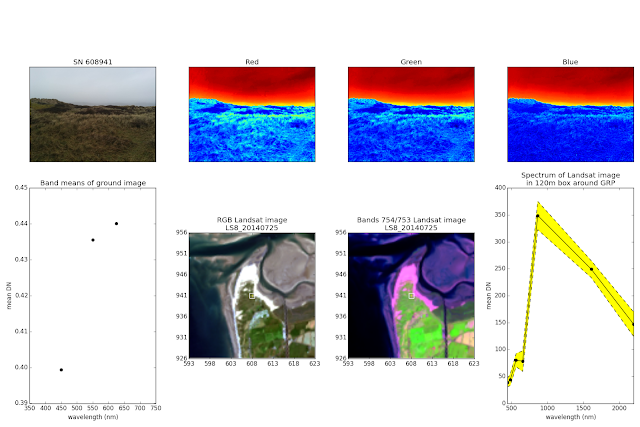
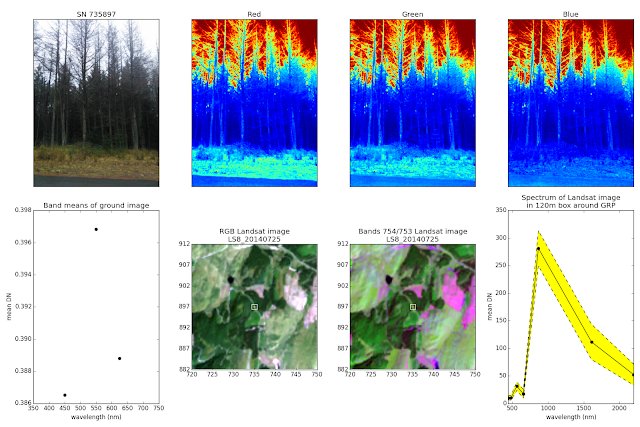
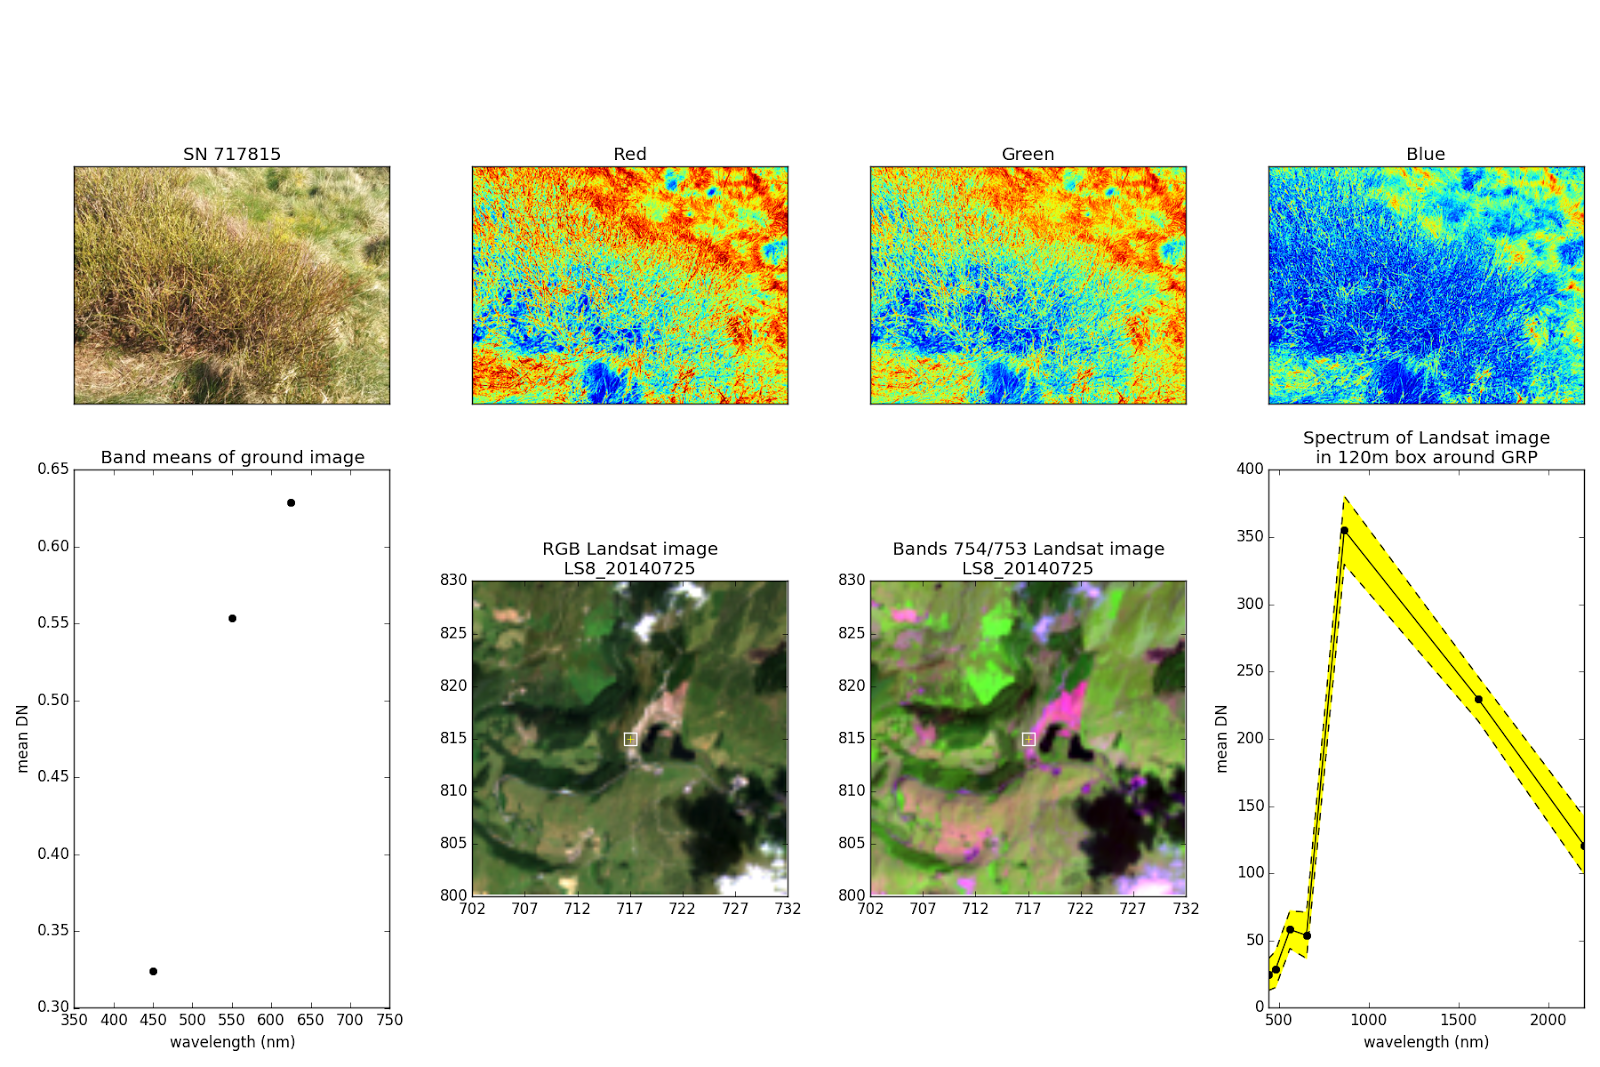
I've made a Python program that takes in a list of image file names and their latitude and longitude co-ordinates from a csv file, and uses these to make a subset of an area of a Landsat image 3km x 3km, and display a spectrum of a smaller area around the point. I presently use an area of 120m x 120m which is 4x4 Landsat pixels.
The code expects a layerstacked image of the optical and near-infrared bands, of which there are 6 for Landsat 7, and 7 for Landsat 8.
It will convert the lat/long coordinates, to OSGB grid references for labelling, and if specified to projected UTM coordinates which the Landsat images are released in.
The output below uses a Landsat 8 image in UTM30N, it is labelled in OSGB, I believe UTM30N grid north is fairly close to OSGB36.
Starting with a few of the pictures from the MSc fieldtrips I mentioned:
The images below are from Landsat 8 in July 2014, with the fieldtrips in Feb/March 2014. The versions in the Google+ album below are from Landsat 7 data from March 2007.
There is a little caveat I will make that certain of the ground level pictures are looking at a point a distance away from the coordinates that are where the photographer was standing.
Also the GPS sometimes made catastrophic errors, and occasionally I have manually edited the coordinates by taking an average of other pictures at the same site (within a small area).
I have also uploaded the output of the fieldwork ground reference points as a Google+ album.

I realised the first step was to create a way of using a list of the images of the ground reference points and their coordinates, to examine the images together with remote-sensed images.
I've made a Python program that takes in a list of image file names and their latitude and longitude co-ordinates from a csv file, and uses these to make a subset of an area of a Landsat image 3km x 3km, and display a spectrum of a smaller area around the point. I presently use an area of 120m x 120m which is 4x4 Landsat pixels.
The code expects a layerstacked image of the optical and near-infrared bands, of which there are 6 for Landsat 7, and 7 for Landsat 8.
It will convert the lat/long coordinates, to OSGB grid references for labelling, and if specified to projected UTM coordinates which the Landsat images are released in.
The output below uses a Landsat 8 image in UTM30N, it is labelled in OSGB, I believe UTM30N grid north is fairly close to OSGB36.
Starting with a few of the pictures from the MSc fieldtrips I mentioned:
The images below are from Landsat 8 in July 2014, with the fieldtrips in Feb/March 2014. The versions in the Google+ album below are from Landsat 7 data from March 2007.
There is a little caveat I will make that certain of the ground level pictures are looking at a point a distance away from the coordinates that are where the photographer was standing.
Also the GPS sometimes made catastrophic errors, and occasionally I have manually edited the coordinates by taking an average of other pictures at the same site (within a small area).
Update:
The code is now available on my Bitbucket account. It only works on Linux and is likely to still be a bit rough and ready at the time of writing.I have also uploaded the output of the fieldwork ground reference points as a Google+ album.
 |
| On the Penglais campus at the back entrance of the Llandinam building. |
 |
| Ynyslas dunes near Borth |

 | |
| Foreshore |
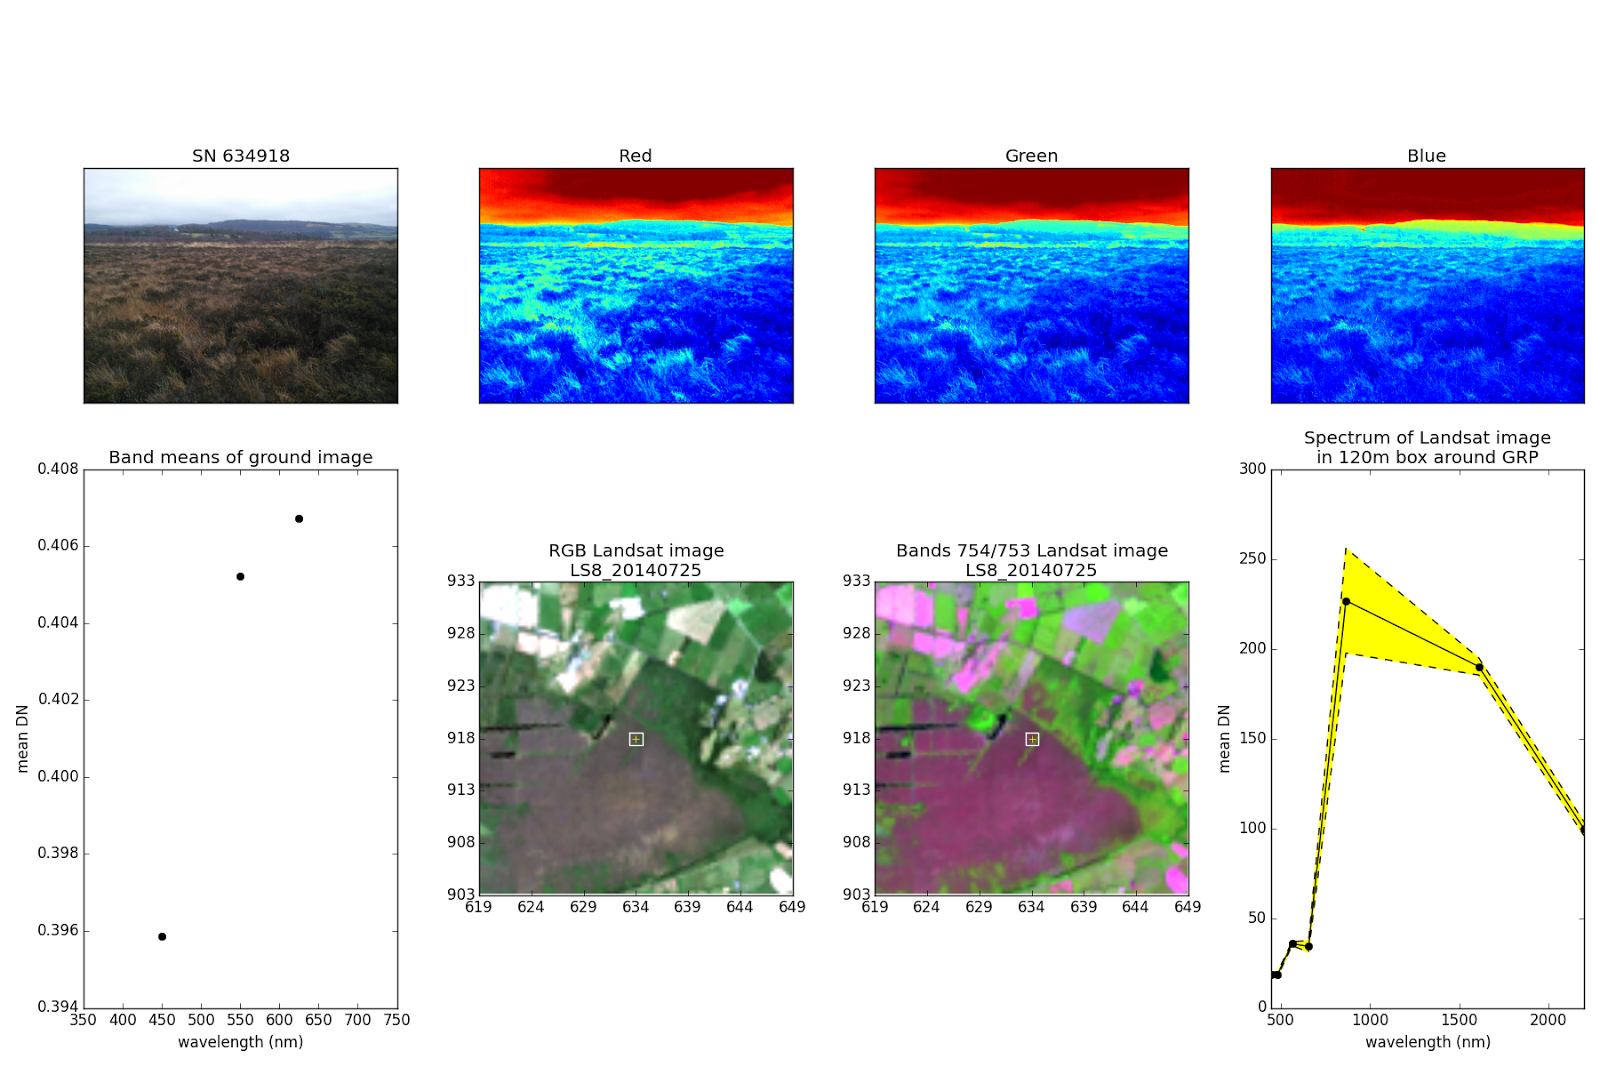 |
| Borth Bog |

 |
| An area of decidious woodland near Tal y Bont |
 |
| Some upland grassland with Dr Pete Bunting |
 | ||
| Vaccinium near Nant y Arian |
 |
| Dead larch |
 |
| Looking west, towards Taylor's Leat, an ingenious method of providing water to drive a wheel to power mining machinery in the 19th century. |

 | |
| Next to Nant y Moch reservoir dam |
Hacking Universal Jobmatch
The Department of Work and Pensions insists that all jobseekers use their online jobsearch website, 'Universal Jobmatch'.
Unfortunately, it can be quite difficult to use, with needing to click through a load of pages filled with mostly agency adverts, which are often duplicates, and sometimes cross-posted to incorrect locations despite the website offering an option to search within a particular radius.
So I thought I'd write a Python script to convert the information to a simple HTML table that one can simply scroll down through without needing to click through 20 or so pages.
I have now tidied it up a bit at put it on Bitbucket: Universal Jobmatch Spam Soup. As I used the Beautiful Soup library and it is written in Python I thought 'Spam Soup' was an appropriate name.
It doesn't really do much to the results, in the way of filtering them beyond what the query returns, but it does make it easier to read I think.
Indicating curvature layers on the slope lines map
In the segmentation discussed in the previous two posts, as well as mean elevation, slope and aspect, I also have two curvature layers, longitudinal, and cross-sectional curvature that I calculated in LandSerf. The definitions of these are explained in the PhD thesis of Jo Wood, the author of LandSerf.
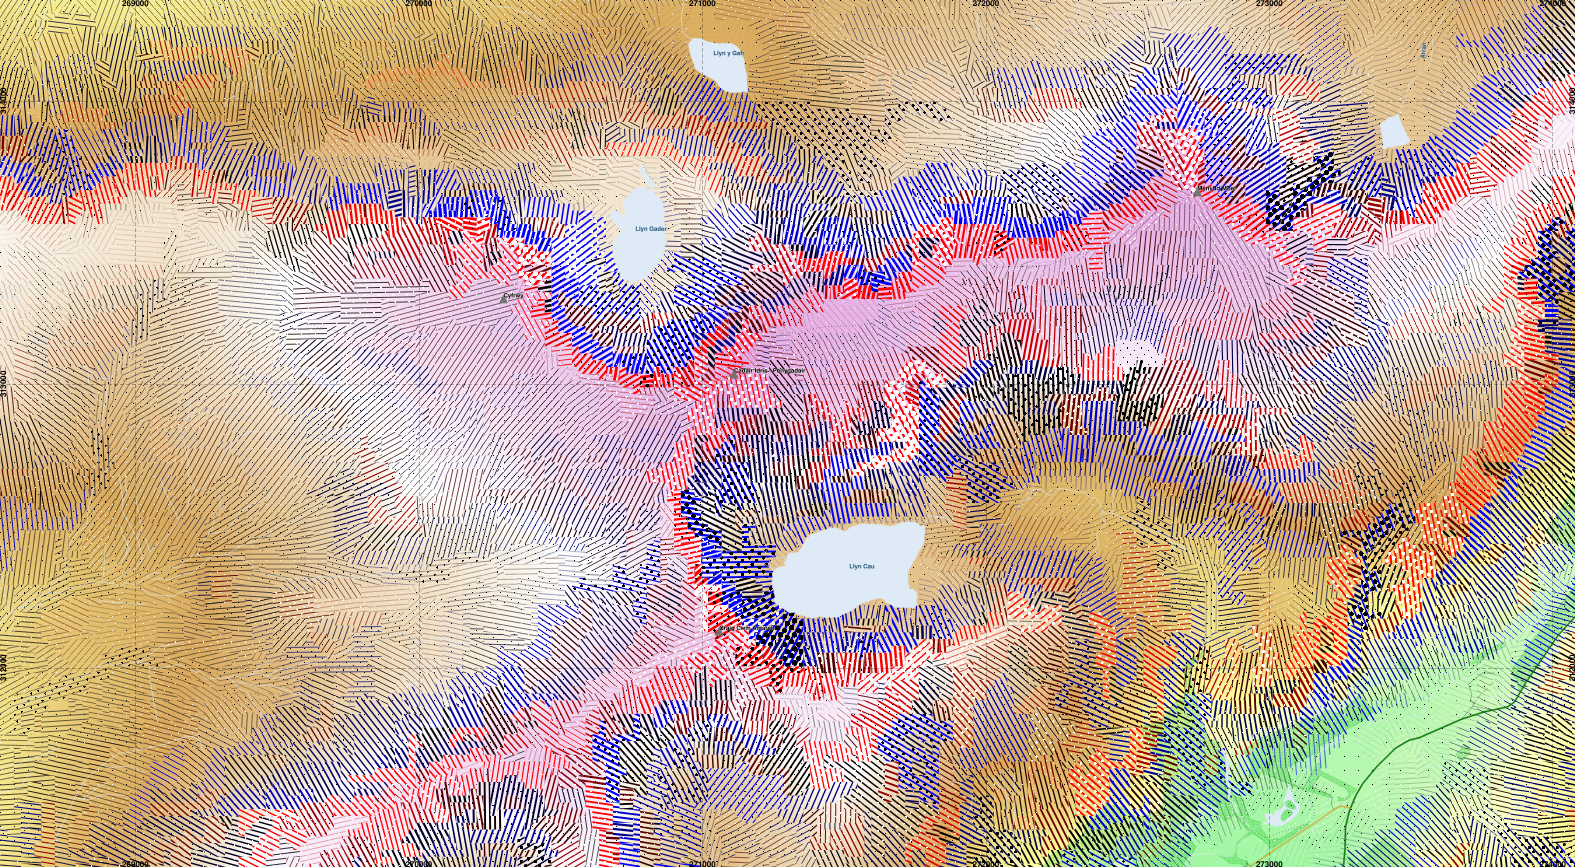
I thought to indicate longitudinal curvature using colour, shading convex slopes in red and concave in blue. Cross-sectional curvature is indicated with dots, which are white for diverging slopes and black for converging. Both of these are normalised by the square root of the segment area relative to the minimum segment area.
I thought to indicate longitudinal curvature using colour, shading convex slopes in red and concave in blue. Cross-sectional curvature is indicated with dots, which are white for diverging slopes and black for converging. Both of these are normalised by the square root of the segment area relative to the minimum segment area.
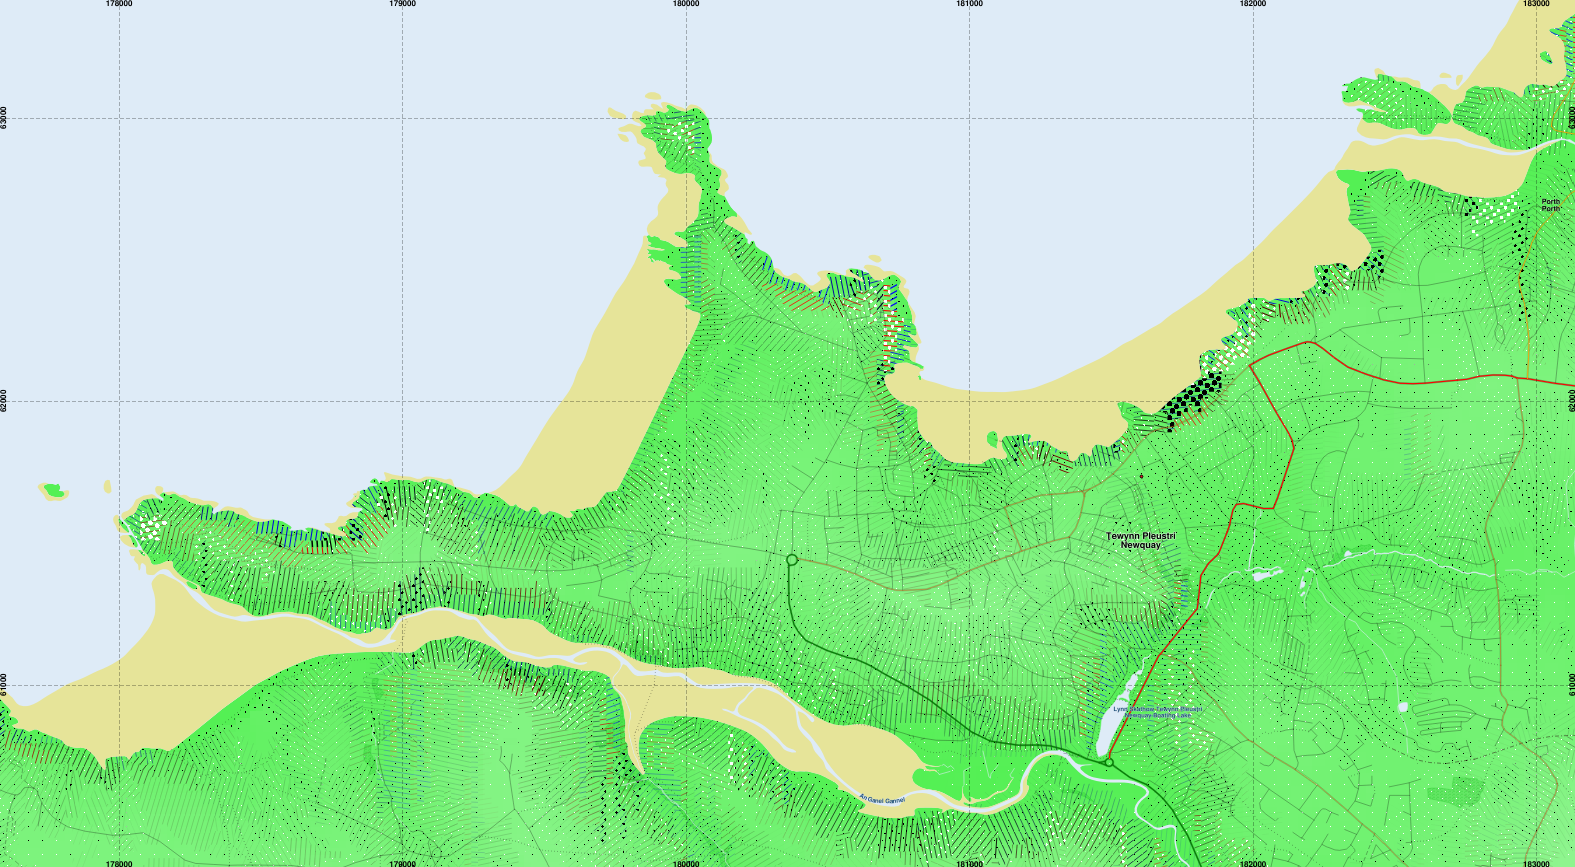 |
| Newquay in Cornwall. Convex slopes appear in red, concave in blue. |
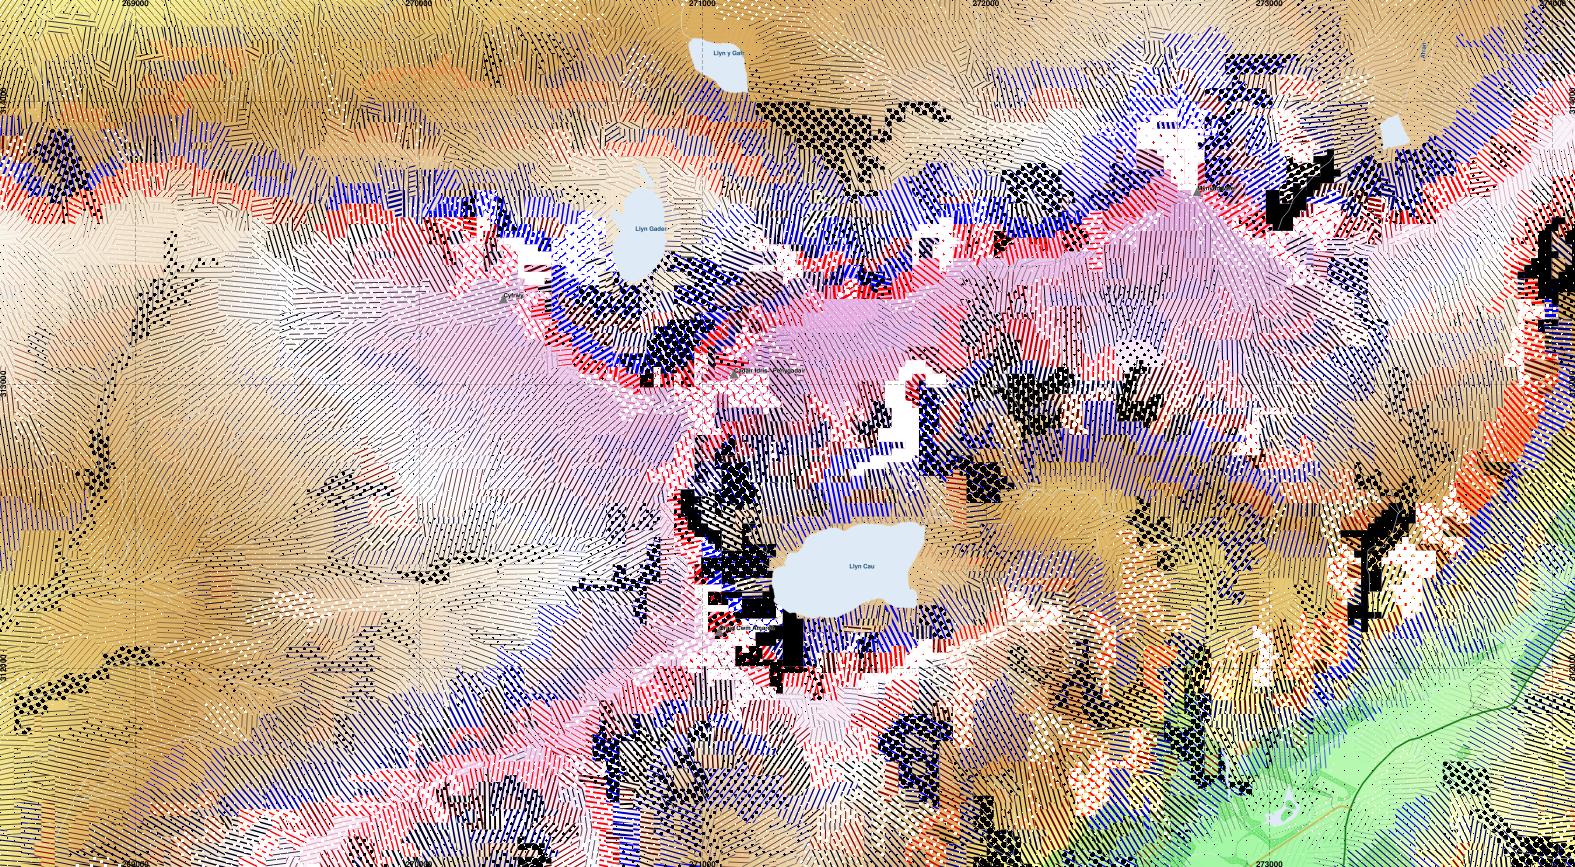 |
| Cadair Idris. Some strongly curved areas create very large dots that fill entire segments above Llyn Cau |
 |
| Rescaling the dots to half their radius. |
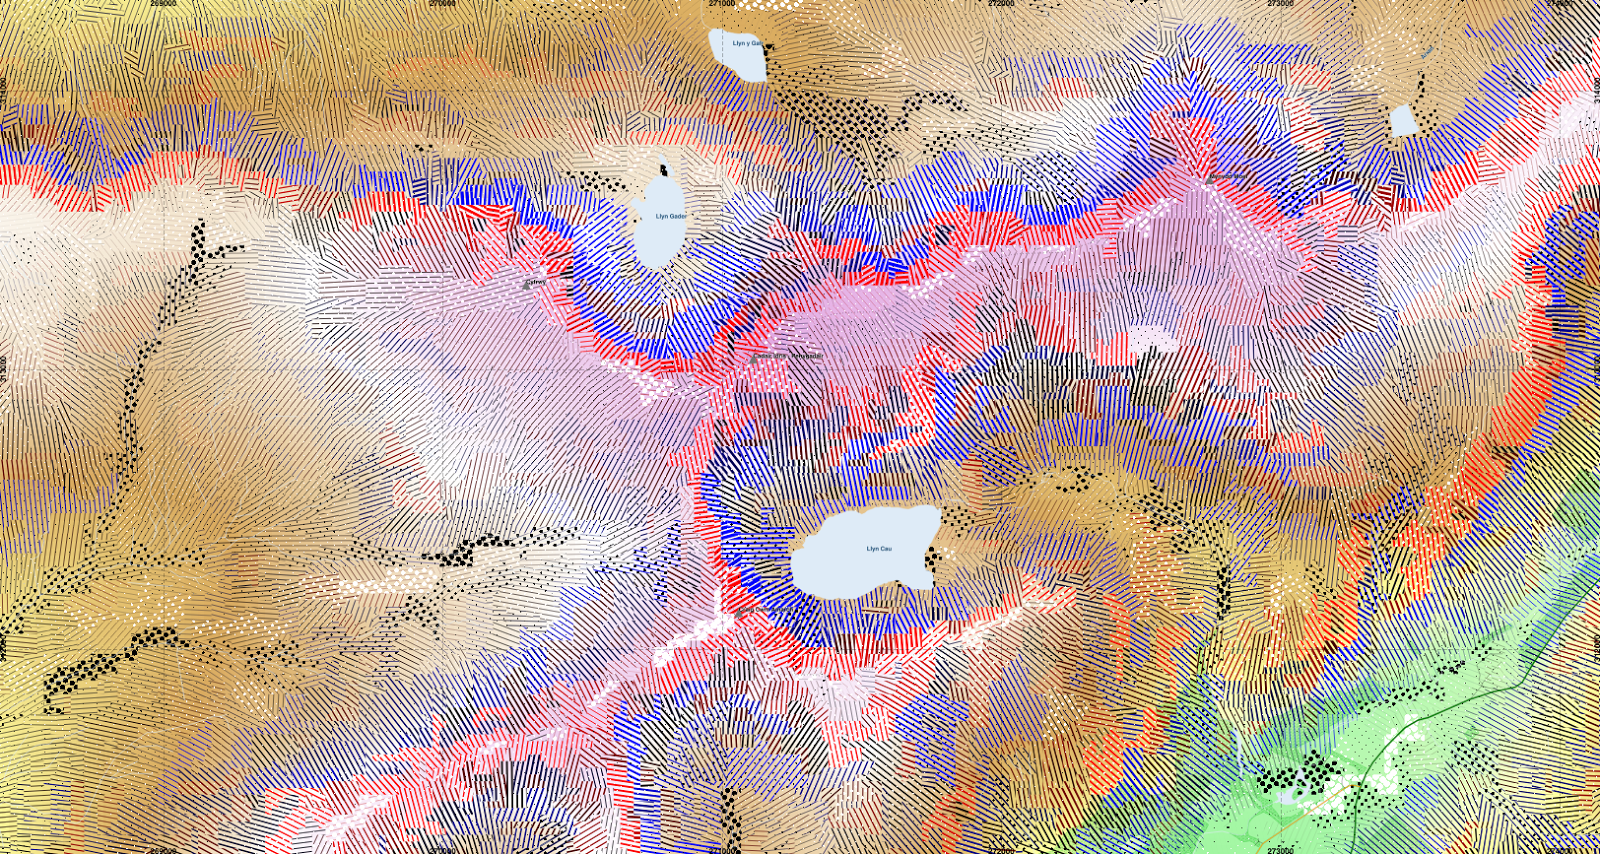 |
| Normalising the radius of the dots by the slope. i.e. reduce dots on steep slopes, and expand those on flatter terrain, such that they are scaled by the magnitude of the cross-sectional curvature relative to the slope. It does get a bit complicated, with the formula for their size in QGIS being "case when RAT_CrScCrv_Mean > 0 then 5*(90/max(RAT_slope_deg_Mean,1))*RAT_CrScCrv_Mean*(sqrt($area/(14*24*24))) else -5*(90/max(RAT_slope_deg_Mean,1))*RAT_CrScCrv_Mean*(sqrt($area/(14*24*24))) end" |
« Prev
1
2
3
4
5
6
7
8
9
10
11
12
13
14
15
16
17
18
19
20
21
22
23
24
25
26
27
28
29
30
31
32
33
34
35
36
37
38
39
40
41
42
43
44
45
46
47
Next »