Skrifennow
My blog, imported from Blogger and converted using Jekyll.
« Prev
1
2
3
4
5
6
7
8
9
10
11
12
13
14
15
16
17
18
19
20
21
22
23
24
25
26
27
28
29
30
31
32
33
34
35
36
37
38
39
40
41
42
43
44
45
46
47
Next »
Revisiting my dissertation work on Mars
In my MSc dissertation at Aberystwyth University, I wrote about mid-latitude glaciers on Mars. I linked the 1309 candidate mid-latitude Martian glaciers published by Colin Souness with topographic data from Mars Express, and made derived topographic layers in GDAL and LandSerf. I made a layerstack of Mars Express images, topography and derived layers and segmented it in RSGISLib, and did some statistical processing to create a kind of naive Bayes classifier to indicate which areas have similarity in topography to the Souness glaciers.
Due to time and space constraints, I did not actually present full results on all of the 179 HRSC tiles within the dissertation. I had intended to do some more afterwards, but at one point my external hard drive failed and I had to re-download some of the data.
In the dissertation, I calculated the distribution of the various variables, both for the whole of the HRSC data tiles I used, and for the areas coinciding with the locations of the Souness glaciers. By comparing the two, a Bayesian classifier is derived.
The head, extent and context areas are explained in the dissertation, the head simply being a small circle around the location of the glacier head as recorded in Souness, the extent being calculated from the width, head, centre and foot recorded, and the context is the extent polygon expanded by 3 times.
I present results from two tiles which were written about in the dissertation, h0248 and h2279, but will be expanded on a little below.
The classifier functions are clearly not specific to the Souness catalogue type glaciers, but may indicate general areas where glacial forms occur, or possibly areas where glacial forms existed in the past.
Due to time and space constraints, I did not actually present full results on all of the 179 HRSC tiles within the dissertation. I had intended to do some more afterwards, but at one point my external hard drive failed and I had to re-download some of the data.
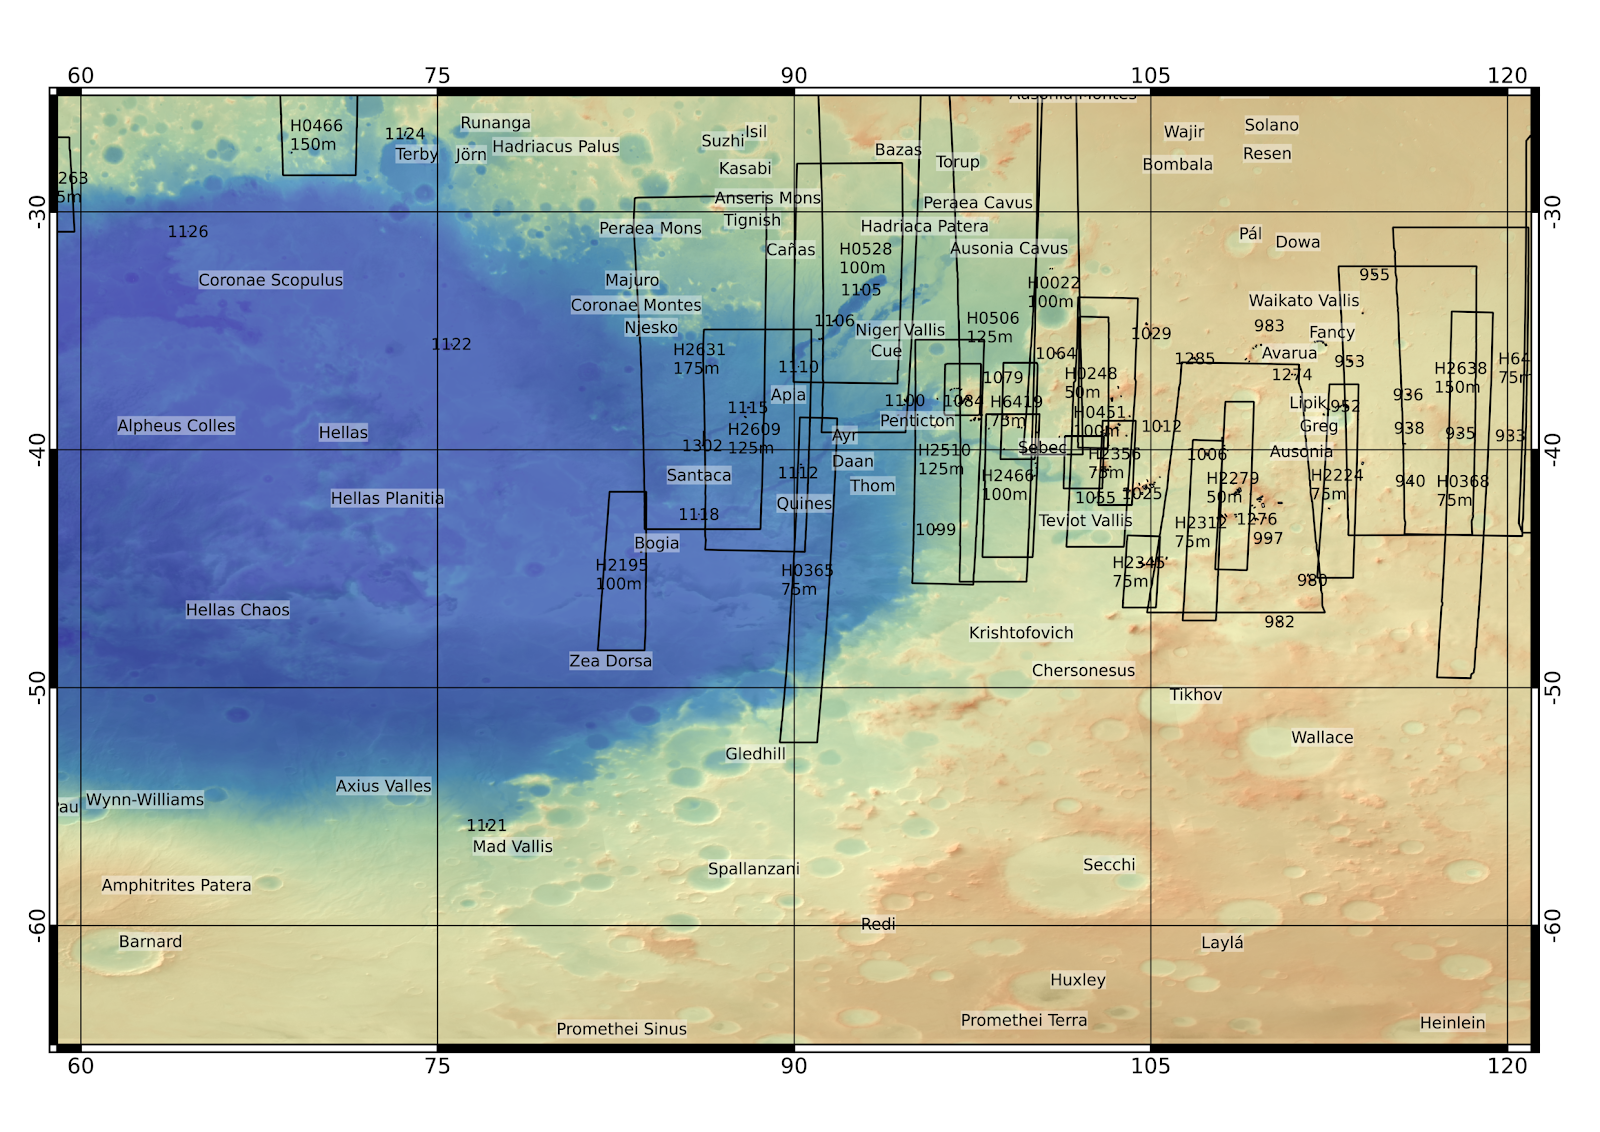 |
| A figure from my dissertation with colourized MOLA elevation, overlaid on a Mars Orbiter Camera wide-angle mosaic images by transparency, showing the general area. Unfortunately I lost the MOC images and spent some time trying to reproject them again correctly since, and I kept getting an offset between it and the other data. Fortunately there is a version available from the USGS that has already been put into the same projection as MOLA. |
In the dissertation, I calculated the distribution of the various variables, both for the whole of the HRSC data tiles I used, and for the areas coinciding with the locations of the Souness glaciers. By comparing the two, a Bayesian classifier is derived.
The head, extent and context areas are explained in the dissertation, the head simply being a small circle around the location of the glacier head as recorded in Souness, the extent being calculated from the width, head, centre and foot recorded, and the context is the extent polygon expanded by 3 times.
I present results from two tiles which were written about in the dissertation, h0248 and h2279, but will be expanded on a little below.
update (13/06/15)
I have corrected an error in the classification script that gave spuriously small values of the 'Extents' classifier function, and revised it to take the nadir image data out of the classifier, since it is scaled separately for each tile, it doesn't make a lot of sense to consider it in the context of global statistics.h0248
larger version (25m/pixel) |
The region near the bottom of the image shows a number of Souness glaciers, which are in an area which is indicated by the classifier, however there are several regions that are indicated by the classifier which do not have any Souness glaciers. There are other glacial features such as crater fills that were beyond the scope of Souness's catalogue, which focused on forms analogous to valley glaciers on Earth. |
h2279
larger version (25m/pixel) |
| Again, a number of Souness glaciers are shown, which have a high classifier value but regions with high values exist that do not have any Souness catalogued objects. |
Remote Sensing and GIS links page
Some time ago I posted a links page, I have added some more and rearranged it a bit:
Remote Sensing sensors and data:
- Landsat home page at the US Geological Survey.
- NASA Landsat Science page.
- US geological survey Earth Explorer interface for accessing Landsat (and other) satellite data.
- ASTER (Advanced Spaceborne Thermal Emission and Reflection Radiometer) homepage. ASTER is an imaging instrument onboard Terra, the flagship satellite of NASA's Earth Observing System (EOS).
- information on TERRASAR-X (Synthetic Aperture Radar satellite).
- The SPOT series of commercially operated optical high-resolution multispectral satellites.
- The European Space Agency's Copernicus programme (previously known as the Global Monitoring for Environment and Security programme (GMES)), including the current and upcoming Sentinel series of Earth observation satellites.
- Including information on the Worldview series of satellites.
- In 2000, the Space Shuttle flew a radar that produced a digital elevation map of the world. The 1 arcsecond data from that is now available for most of the world, previously only the USA had 1 arcsecond data publicly released, with the data covering the rest of the world released at 3 arcseconds resolution. Since September 2014, the 1 arcsecond data has been released for most of the world.
Earth-based Applications of Remote Sensing and GIS
- By the International Arctic Research Center (IARC) in corporation with the Japan Aerospace Exploration Agency (JAXA).
- Johnny Ryan, PhD student of Prof. Alan Hubbard in Aberystwyth University, writing about the project using a fixed-wing unmanned aerial vehicle (UAV) in West Greenland to survey the cryosphere at fine temporal and spatial scales. Johnny tweets as @glaciology_uavs.
- by the US Geological Society using Landsat and other remote sensing information.
- A map of (modelled from urbanization) night sky light pollution across Europe. A map of Great Britain can be viewed at www.avex-asso.org/dossiers/wordpress/?page_id=127
- A map of artificial light at night based on satellite observations from 2006, covering the whole world.
- The idea behind the Past Earth Network (PEN) is that much can be learned about how our climate models will perform in a changed climate, by studying past climate. To make this happen, the network will improve communication between Palaeo-climate scientists and statisticians.
- a special issue of the open-access journal Remote Sensing, focusing on object-based methods of image analysis. This includes the paper Clewley et al. 2014 demonstrating RSGISLib and other Python-based open source software techniques.
- UAV studies of forests by the Institute of Aviation in Warsaw & the Forest Research Institute in Sękocin. Google Translate to EnglishUsing UAVs with optical and near-infrared cameras for forest health studies. Google Translate does make some mistranslations, but it is generally comprehensible if you ignore the bit about the 'raids' on the forest.
- a daily picture showcasing something in Earth Science.
Planetary Science Applications
- NASA Planetary Data System.
- PDS Geosciences Node Orbital Data Explorer, covering Mars, the Moon, Mercury and Venus.
- Main NASA Mars page.
- JMARS is an acronym that stands for Java Mission-planning and Analysis for Remote Sensing. It is a geospatial information system (GIS) developed by Arizona State University's Mars Space Flight Facility to provide mission planning and data analysis tools to NASA's orbiters, instrument team members, students of all ages, and the general public.
- HiView is a downloadable software tool, the best way to explore HiRISE (the high resolution imaging instrument on NASA's Mars Reconnaissance Orbiter) images of the Martian surface at the full resolution of the imagery.
- The main page at the European Space Agency giving infromation about the Mars Express mission, images, and the latest news.
- web interface to the Mars Express High Resolution Stereo Camera image archive.
- Stephen Brough, PhD student at Aberystwyth's blog about his research on glaciers on Mars.
- website of Professor Dave Marchant of Boston University's Antarctic Research Group about the Dry Valleys of Antarctica as an analogue to conditions on Mars.
- a crater in the mid-latitudes of the southern hemisphere of Mars, which shows glacier-like features in its walls. Paper by W. Hartmann et al.
- From the USGS, a list of links to various Mars datasets including mosaicked Mars Global Surveyor imagery and topography, and many others.
- What time is it on Mars?
- information on Chang'e 3 Chinese lunar mission.
- information on Chang'e 3 Chinese lunar mission.
- Lunar Reconnaisance Orbiter homepage.
- NASA Cassini Orbiter page.
- Cassini Imaging Central Laboratry for Operations - Optical and near infrared imaging from the Cassini spaceprobe.
- Cassini Visual and Infrared Mapping Spectrometer website.
- One of the remotest sensors of all, NASAs New Horizons probe flying by Pluto on 14th July 2015.
Astronomy links
- On August 21, 2017, millions of people across the United States will see nature's most wondrous spectacle — a total eclipse of the Sun. It is a scene of unimaginable beauty; the Moon completely blocks the Sun, daytime becomes a deep twilight, and the Sun’s corona shimmers in the darkened sky. This is your guide to understand, prepare for, and view this rare celestial event. March 20th 2015 eclipse in Faroe Island and Svalbard.
- A website that details the passes of the International Space station, Iridium flares and other artificial satellites, as well as providing information on planets etc. visible in the sky.
- Free planetarium software. The program enables you to draw sky charts, making use of the data in many catalogs of stars and nebulae. In addition the position of planets, asteroids and comets are shown.
- Solar Eclipse prediction software, which shows the track of the moon's shadow on the Earth, and local circumstances including magnitude, start/end times and duration of totality for eclipses between 13000BC and 16999AD. Also see LmapWin for lunar eclipses.
Remote Sensing and GIS software, tutorials etc.
- Dan Clewley's blog on open-source remote sensing software.
- Online access to ArcGIS Help.
- QGIS project page where you can find the free and open source QGIS software.
- A self-paced course on free & open source software for geospatial (FOSS4G) applications from the Free and Open Source Software 4 Geo Academy. 5 self-paced courses using QGIS (and a bit of GRASS7) are available.
- QGIS blog by QGIS developer and data visualisation specialist Anita Graser.
- A GIS blog containing tips and tutorials on QGIS.
- Blog by Luca Congedo, the author of the Semi-Automatic Classification Plugin for QGIS that allows for supervised Land Cover classifications.
- This reference manual details the use of modules distributed with Geographic Resources Analysis Support System (GRASS), an open source (GNU GPLed), image processing and geographic information system (GIS).
- Carleton University Open Source GIS tutorials.
- a free and open source program to manage GPS data. This can import data from a GPS device and add map layers from OpenStreetMap and digital elevation model data.
- GIS information portal.
- Online converter in Javascript from Lat/Long to OSGB grid references and vice versa.
- -Downloadable Grid Inquest software from the UK Ordnance Survey to convert between Lat/long and OSGB grid references. An online batch converter is also available.
- An online database of spatial reference descriptions in a large number of geographic and projected coordinate systems.
- Flex Projector is a freeware, cross-platform application for creating custom world map projections. The intuitive interface allows users to easily modify dozens of popular world map projections - the possibilities range from slight adjustments to making completely new projections. Flex Projector is intended as a tool for practicing mapmakers and students of cartography.
- free open source image analysis software.
- Geomorphons are a pattern recognition method of terrain analysis developed by Tomasz Stepinski and Jaroslaw Jasiewicz. It is available as a Web-based utility that allows users to calculate geomorphons maps from their own DEMs (for smaller datasets) and also as a GRASS7 module. Blog post including video of lecture about it.
- Written by Prof. Jo Wood, LandSerf is a freely available Geographical Information System (GIS) for the visualisation and analysis of surfaces. Applications include visualisation of landscapes; geomorphological analysis; gaming development; GIS file conversion; map output; archaeological mapping and analysis; surface modelling and many others. It runs on any platform that supports the Java Runtime Environment (Windows, MacOSX, Unix, Linux etc. I used it myself in my dissertation on Martian glaciers.
Python
- The official Python website with online documentation and tutorials.
- The Code Academy Python track with interactive tutorials.
- NumPy is the fundamental package for scientific computing with Python. A tutorial with a set of 100 exercises is available at this site.
- Remote Sensing and GIS library: a collection of tools for processing remote sensing and GIS datasets, used via a Python library or XML bindings.
- ARCSI atmospheric correction software (Python).
- Py6S (Second Simulation of the Satellite Signal in the Solar Spectrum) - a Python library implementing atmospheric correction models.
- video lecture on matplotlib (plotting library for Python) by one of its developers (dates from 2008).
- Matplotlib homepage with documentation on using matplotlib to create plots of data in Python.
- Tutorials on Python scikit-learn and AstroML machine learning libraries, and Matplotlib data visualization.
- a website allowing use of the power of matplotlib in a GUI within the browser without the need for coding by the user.
- read and write KML files suitable for Google Earth.
- Joel Lawhead's Geospatial Python blog.
- Python Shapefile library.
- geopy - geocoding for python
HTML, CSS and Javascript
- the web programming track at Codecademy. Javascript tutorials also are available.
- translates the time to an HTML colour.
- A list of named HTML colours.
- online tutorial on the layout features of CSS styling.
- Tutorial for WebGL. WebGL is an in-browser 3D renderer based on OpenGL, which lets you display your 3D content directly into an HTML5 page.
- An example of rendering a large terrain in 3D using WebGL.
Online Mapping
- OpenStreetMap - a free and user-editable online map.
- National Library of Scotland Historical Ordnance Survey maps of Great Britain dating from 1920s-1940s.
- Website of OSM developer Andy Allan.
- OSM data with topography of UK and Ireland exported for Garmin GPS units.
- Jochen Topf's test site allowing a choice of language labels rendering OpenStreetMap.
- A Javascript tool to export directions as a GPX file from Google Maps.
- Draw the elevation profile of your bicycle routes.
- Soviet military topographic maps. The 1:500k series are also available from this website: landkartenarchiv.de.
- The LoTR project has created an interactive map of Middle Earth in Tolkein's Lord of the Rings.
Downloadable GIS data
- Various raster and vector layers are available.
- A categorised list of freely available GIS data compiled by Robin Wilson.
- Geofabrik's free download server. This server has data extracts from the OpenStreetMap project which are normally updated every day. Select your continent and then your country of interest.
- various lists of hills and mountains in the British Isles.
- The Atlas of UK Marine Renewable Energy Resources.
- A collection of datasets focused on Antarctica for use with QGIS.
- A Global Self-consistent, Hierarchical, High-resolution Geography Database. The GSHHG is a high-resolution geography data set, amalgamated from two databases in the public domain: World Vector Shorelines (WVS) and CIA World Data Bank II (WDBII). The WDBII source also provides all political borders and rivers.
- Available free to download from the British Geological Survey.
Cartography and Data Visualisation Advice
- Colour Palettes, including selecting palettes to reproduce effectively in print, and for colour-blind viewers.
- Colours for data scientists. Generate and refine palettes of optimally distinct colors.
- Freelance data visualisation consultant Jason Davies' page.
- NASA blog on data visualisation.
- Data visualisation online community and blog.
- Ideas and Techniques about Relief Presentation on Maps. Includes Cleantopo2, a cleaned of artifacts topographic and bathymetric dataset for cartographic purposes.
Google Fusion Tables
- how to use Google Fusion tables to make a visualisation of data on a customized Google Map.
- an example that I did much of the coding for, showing religious themed historical sites in Cornwall, when I was doing voluntary work with Azook.
- a searchable collection of historical photographs displayed on a map of Cornwall.
- a set of more than 1000 free and customizable icons to use as placemarks for your POI (Point of Interests) locations on your maps.
GIS Data visualisation examples
- from the UCL Centre for Advanced Spatial Analysis. Shows a selection of data from the 2011 England and Wales and Cornwall census. The visualisation clips the output polygons to where there are buildings according to OS Opendata vector maps.
- Interactive Map for UK and Ireland, showing the 100 Great Geosites, selected by The Geological Society.
- A web-based map of the geology of Britain from the British Geological Survey.
- is an ongoing project to create a visual, interactive representation of the Earth's history. Observe the geography of Australasia over the last 120,000 years.
- Visualization of weather data. The program can download NOAA (GFS Model) weather forecasts for 8 days ahead for anywhere in the world.
- Visualization of global weather data, with a Javascript data visualization.
- A data visualization project for "Making sense of climate change responsibility and vulnerability", created by Kiln (website with other examples).
- Part of the National Earthquake Hazards Reduction Program (NEHRP). The latest earthquakes around the world are displayed on a map.
- about London Moves, video visualisation of 16 million cycle journeys in London. Website 'Bicycle visualization and analysis' with further information about the research.
General Mapping Fun
- a lot of interesting things done with maps. warning: procrastination alert.
- warning: procrastination alert.
- A website (in German) with many examples of historical maps, including many examples of the Soviet Union's military maps at 1:500k and 1:1M scale, and among other things maps with various European powers realised as animals (often this is 1st world war propaganda - from all sides).
- A business based in Cornwall, offering quality cartographic and design services on a contract basis for clients of all sizes.
Travel time maps
- find areas within a certain travel time by public transport to a location. This assumes you can walk on water.
- similar, allows using different kinds of transport.
LaTeX (Document processing)
- Getting to Grips with LaTeX by Andrew Roberts.
- Blog with tips and tricks about LaTeX editing.
- a good reference. Includes how to make LaTeX produce a page size optimized for many tablets in the Page Layout chapter.
Art/Science collaboration
- by Julian Ruddock. Website showing his projects that are based on art and science collaboration in relation to climate change.
Citizen Science and crowdsourced cloud computing
- Contribute to climate research with your own computer by running simulations.
Games
- Geoguessr - Google Street View guess the location game.
- similar.
- this one has a time limit.
- Urban Jungle Street View.
Galactic Information Systems
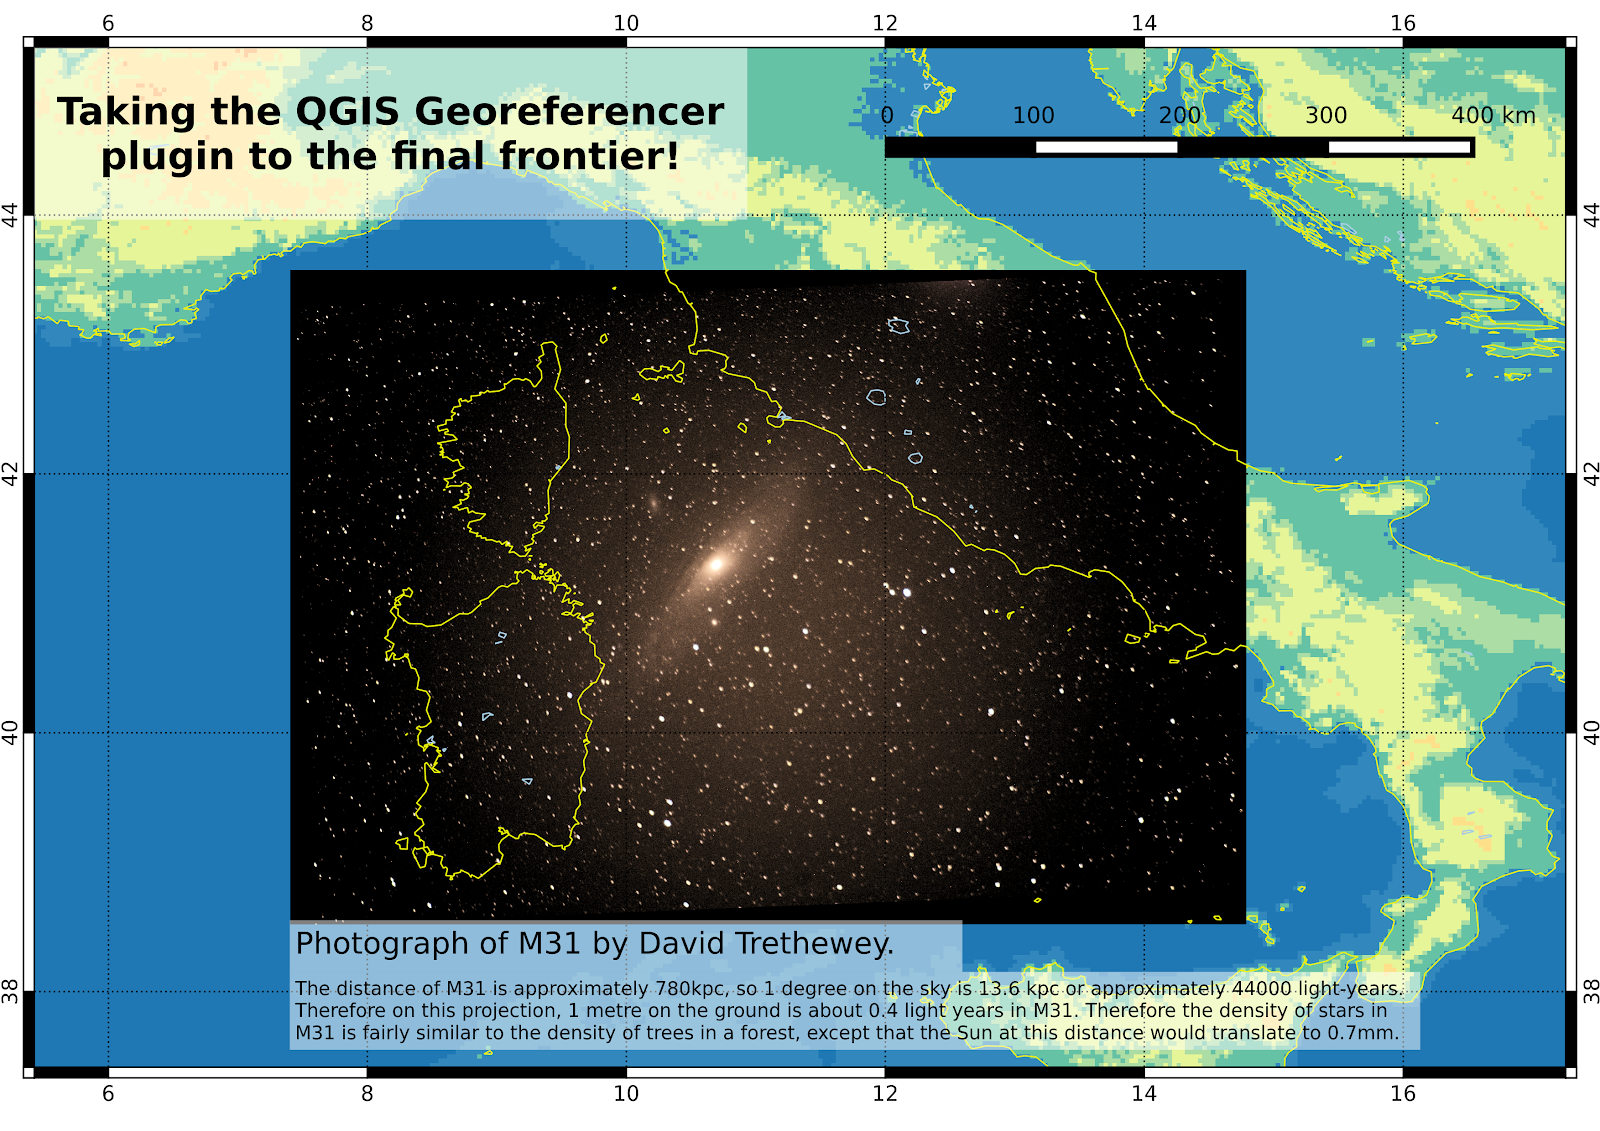
Then with the aid of a star chart, find a few reference points, and use SIMBAD to find coordinates for then. I used the M31 centre, the satellite galaxies M32 and M110, and the stars 35 and 32 And.
The result was that M31 is just off the coast of Italy.
The distance of M31 is approximately 780 kiloparsecs, 1 parsec being 3.09x10¹⁶m. 1 degree on the sky corresponds to 13.6kpc at M31's distance (note that the stars in the image are Milky Way stars and much closer) and that means that 1 metre on the ground translates to 0.4 light years in M31.
Therefore the density of stars in M31 is perhaps similar to the corresponding density of trees in a forest, except of course that the stars are arranged in a 3 dimensional structure, and the stars themselves are vastly smaller then the corresponding trees, the Sun's diameter at M31 distance corresponding to about 0.7mm on the Earth, the size of a small insect.
Some more work in progress re: Cornish GIS maps
Here is a little more about my work in progress in generating maps of Cornwall in QGIS.
I have downloaded various Ordnance Survey VectorMap data, along with some layers which come from OpenStreetMap. The OS VectorMap has layers including woodland, tidal water, surface water polygons (e.g. lakes and reservoirs), foreshore and surface water lines (rivers etc.) and others.
These is more comprehensive than OpenStreetMap, however the OpenStreetMap vector layers come with names associated with them in the attribute table in some cases. Certain of the OS VectorMap layer objects will exist in the VectorMap 'Named Places' shapefile, but as points rather than as names in the attribute tables of the polygons themselves.
In the map below I have used the woodland polygons from the OS VectorMap and the ones from OpenStreetMap, but only the OpenStreetMap ones are labelled, since only they have names in the table.
I have also generated contours based on the Shuttle Radar Topography Mission, 1 arcsecond data, which is now freely available for most of the world. It is also possible to use OS Terrain50 contours, which generally appear smoother than these ones, however given these are released in individual squares, I found myself having so many vector layers in the rendering that QGIS crashed.
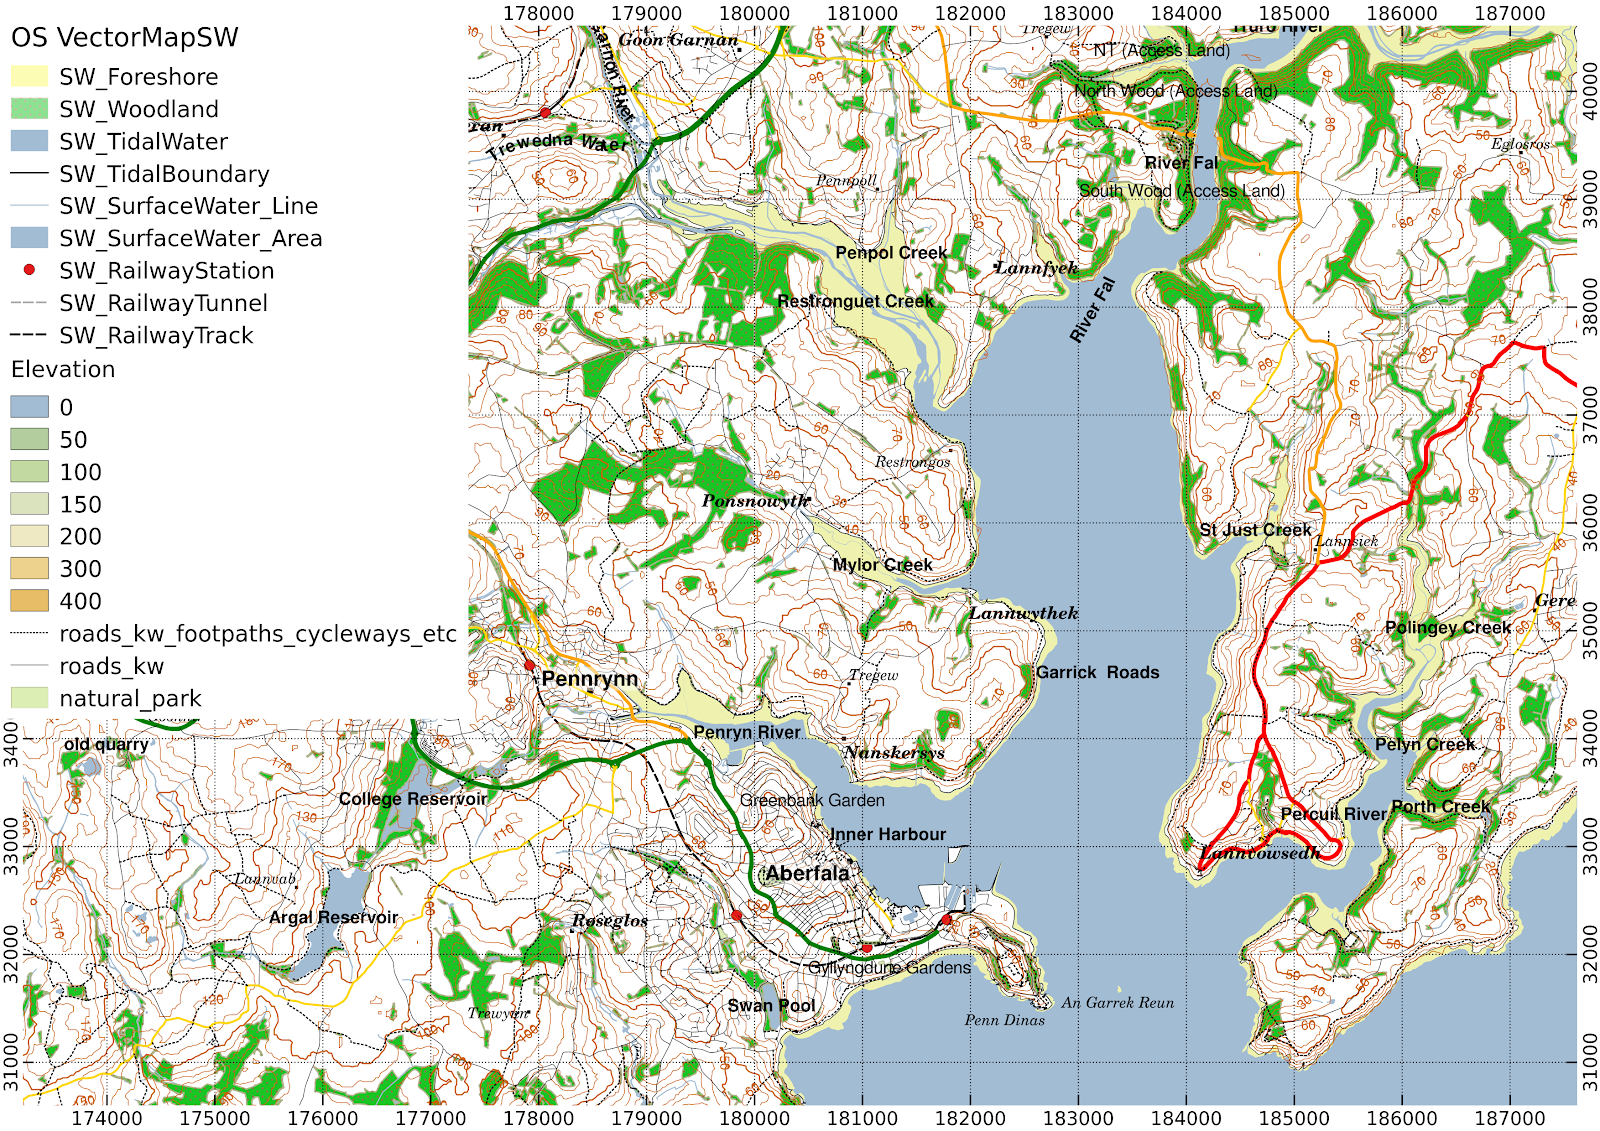 |
| The Falmouth area, using contours from SRTM 1 arcsec |
There is a fairly large amount of data entry to be done to put the names in Cornish, and beyond the list that has already been published by MAGA I would expect it to be slower work.
The OS VectorMap Named Places shapefile for the SW grid square has 2759 entries, of which 679 are various geographic features and the remainder are populated places.
The OpenStreetMap files have approximately 122 named woodlands in Cornwall (of 810 polygons, of over 9000 in the SW grid square alone for OS VectorMap), 56 named water polygons (of 327), 21 parks (of 45), 242 named waterways (of 2923) as lines (some duplicate names for different parts of a feature), and 1337 named places (of which I have already entered 421 in Cornish based on the MAGA Kernow list). There are 10342 named roads in Cornwall from the Open Street Map data.
Georeferencing a tithe map and overlaying modern mapping in QGIS
The National Library of Wales recently released a tithe map of St Woolos, Newport to Wikimedia Commons. There is a crowdsourced project to digitise, georeference, and transcribe the field names from these maps, however I wanted to try out geoferencing in QGIS with its georeferencing plugin, partly because it may be useful in the Taves an Tir project that Kowethas an Yeth Kernewek are doing, since scans have also been made of the tithe maps of Cornwall.
After downloading the full resolution (16,298 × 22,877 pixels) tithe map of St. Woolos, I used the QGIS georeferencer plugin which works by matching manually chosen points between the scan, and a map. In this case I used a map of the UK road network ultimately from OpenStreetMap via www.mapcruzin.com, as well as some of the OS VectorMap data. This includes railways, woodland areas and parks shown below. I styled the road map in QGIS depending on the category of road.
I used 8 points, finding road junctions that I could match between the two maps and a Helmert transformation (more information from QGIS web documentation). It was clear when I did this that one of my points was incorrectly placed, which isn't too surprising given the road network has changed since 1845, but discarding this gave a good result.
I've also downloaded some of the 1 arcsec resolution Shuttle Radar Topography Mission data, which has recently been made available for most of the world, including the British Isles, and transformed this to a contour map in QGIS.
Below is a map of a portion of the St. Woolas tithe map area, with the modern road network overlaid along with OS VectorMap data for railways, woodland, surface water and parks.
There are many options in QGIS for feature labelling, for instance it is possible to suppress labelling of small features to avoid label overcrowding, which makes it label street names selectively.
It is slightly involved to extract this from a download from http://download.geofabrik.de/ because it is in an 'other_tags' column along with various other things and a bit of string slicing is needed to get it out.
The name:cy tag is only used where the Welsh language form of the place differs from the version commonly used on English maps.
After downloading the full resolution (16,298 × 22,877 pixels) tithe map of St. Woolos, I used the QGIS georeferencer plugin which works by matching manually chosen points between the scan, and a map. In this case I used a map of the UK road network ultimately from OpenStreetMap via www.mapcruzin.com, as well as some of the OS VectorMap data. This includes railways, woodland areas and parks shown below. I styled the road map in QGIS depending on the category of road.
I used 8 points, finding road junctions that I could match between the two maps and a Helmert transformation (more information from QGIS web documentation). It was clear when I did this that one of my points was incorrectly placed, which isn't too surprising given the road network has changed since 1845, but discarding this gave a good result.
I've also downloaded some of the 1 arcsec resolution Shuttle Radar Topography Mission data, which has recently been made available for most of the world, including the British Isles, and transformed this to a contour map in QGIS.
Below is a map of a portion of the St. Woolas tithe map area, with the modern road network overlaid along with OS VectorMap data for railways, woodland, surface water and parks.
There are many options in QGIS for feature labelling, for instance it is possible to suppress labelling of small features to avoid label overcrowding, which makes it label street names selectively.
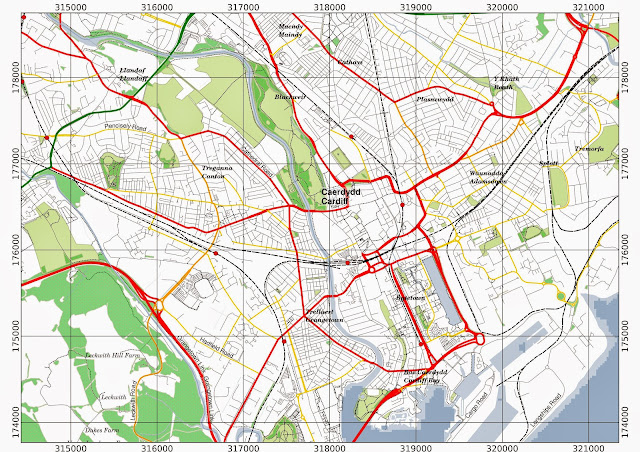
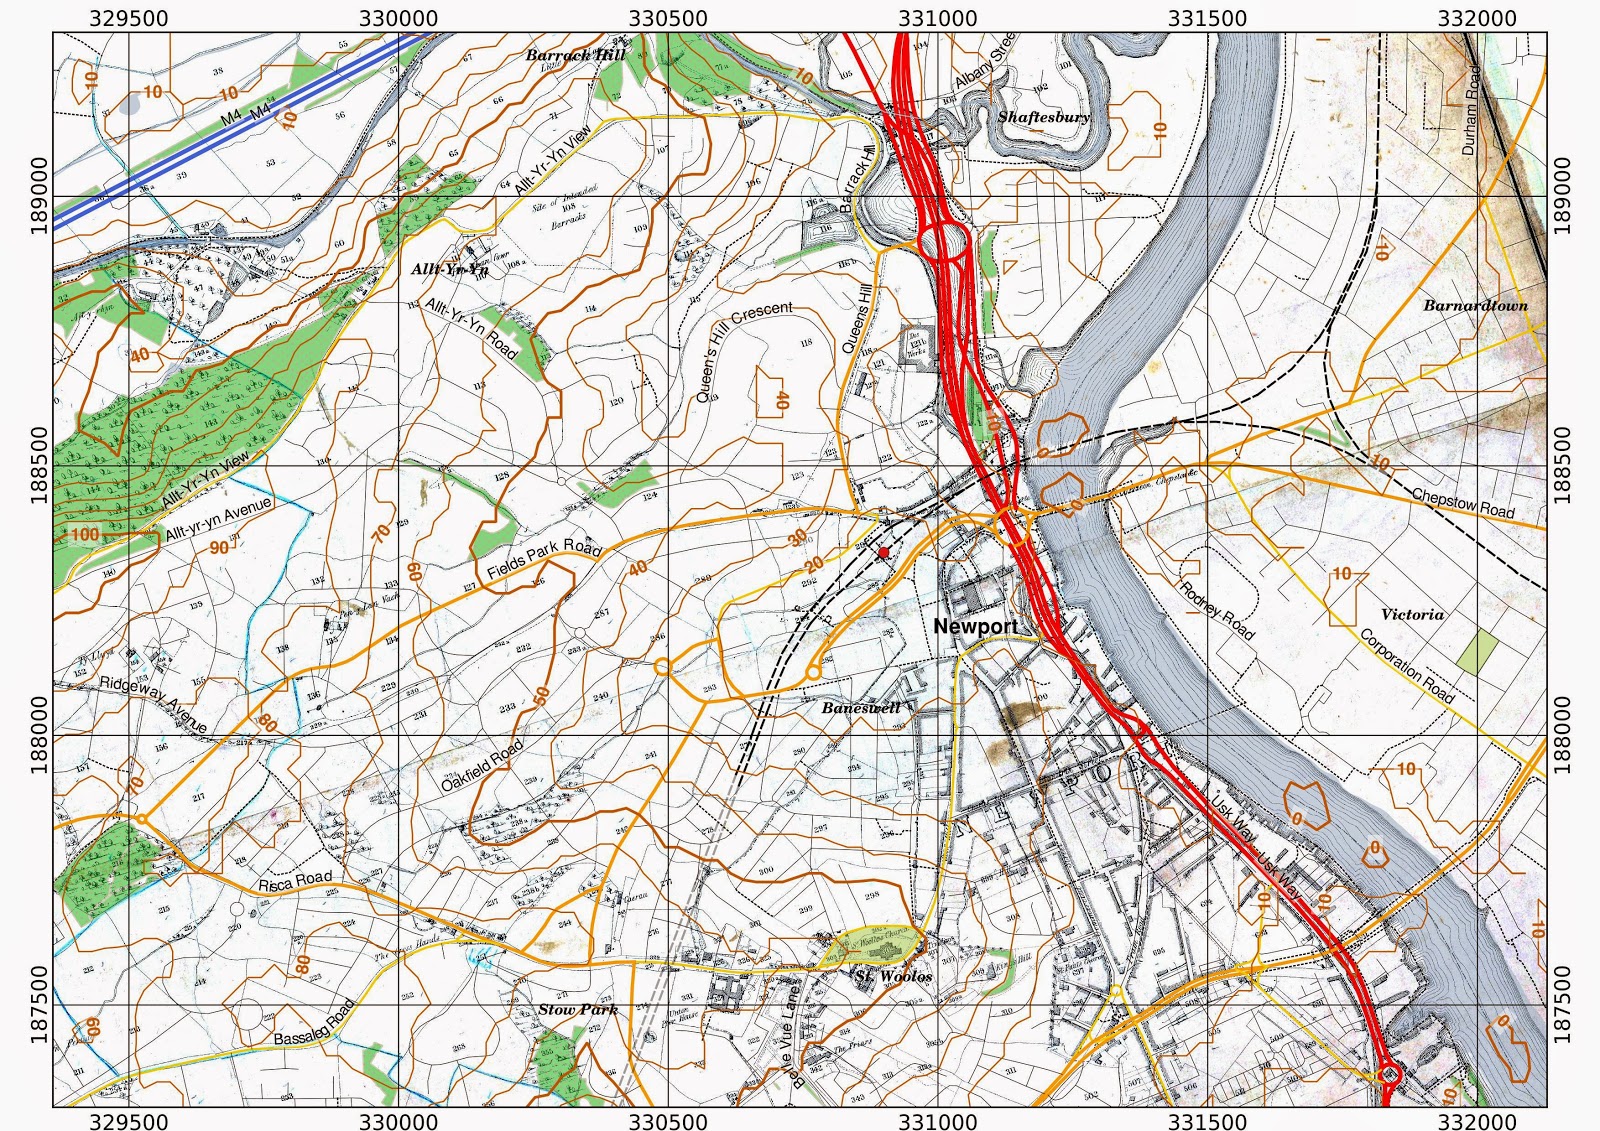 |
| Link to higher resolution version (8MB png file) |
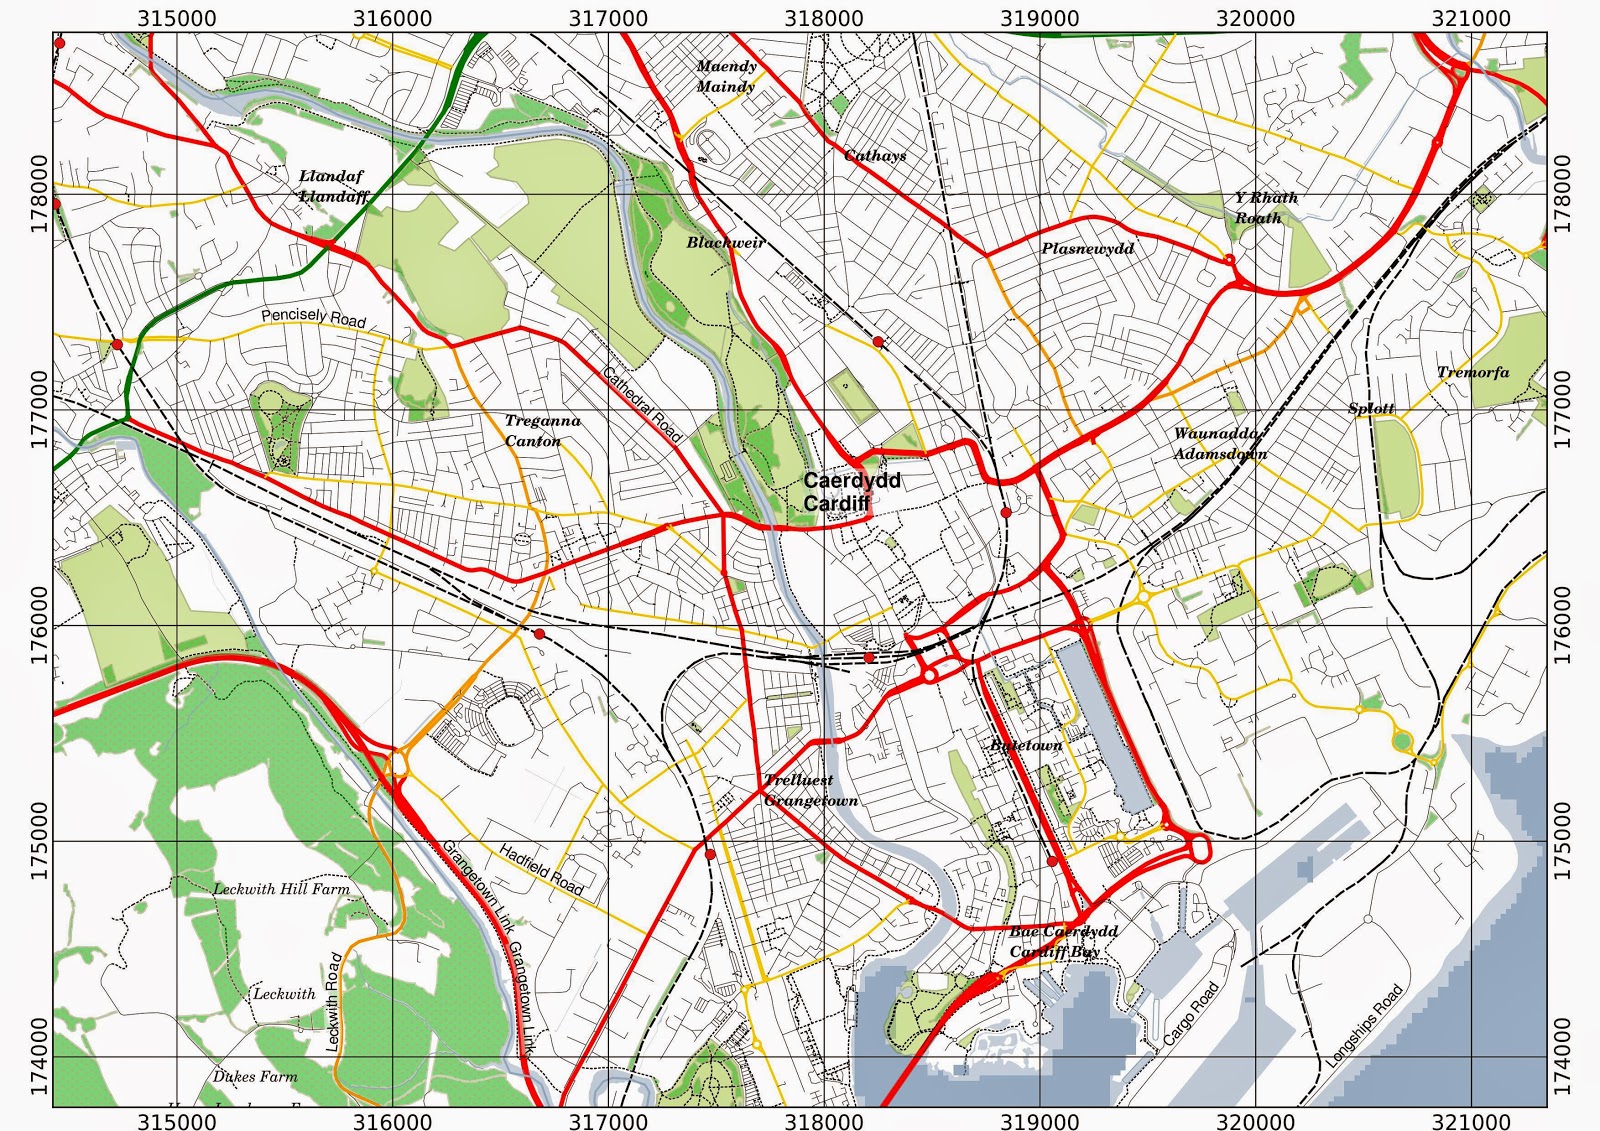
Aside - Welsh language names in OpenStreetMap
OpenStreetMap does have some Welsh language names, if the name:cy tag is used. It is possible to see these using the Multilingual Map Test site by Jochen Topf.It is slightly involved to extract this from a download from http://download.geofabrik.de/ because it is in an 'other_tags' column along with various other things and a bit of string slicing is needed to get it out.
The name:cy tag is only used where the Welsh language form of the place differs from the version commonly used on English maps.
« Prev
1
2
3
4
5
6
7
8
9
10
11
12
13
14
15
16
17
18
19
20
21
22
23
24
25
26
27
28
29
30
31
32
33
34
35
36
37
38
39
40
41
42
43
44
45
46
47
Next »