Skrifennow
My blog, imported from Blogger and converted using Jekyll.
« Prev
1
2
3
4
5
6
7
8
9
10
11
12
13
14
15
16
17
18
19
20
21
22
23
24
25
26
27
28
29
30
31
32
33
34
35
36
37
38
39
40
41
42
43
44
45
46
47
Next »
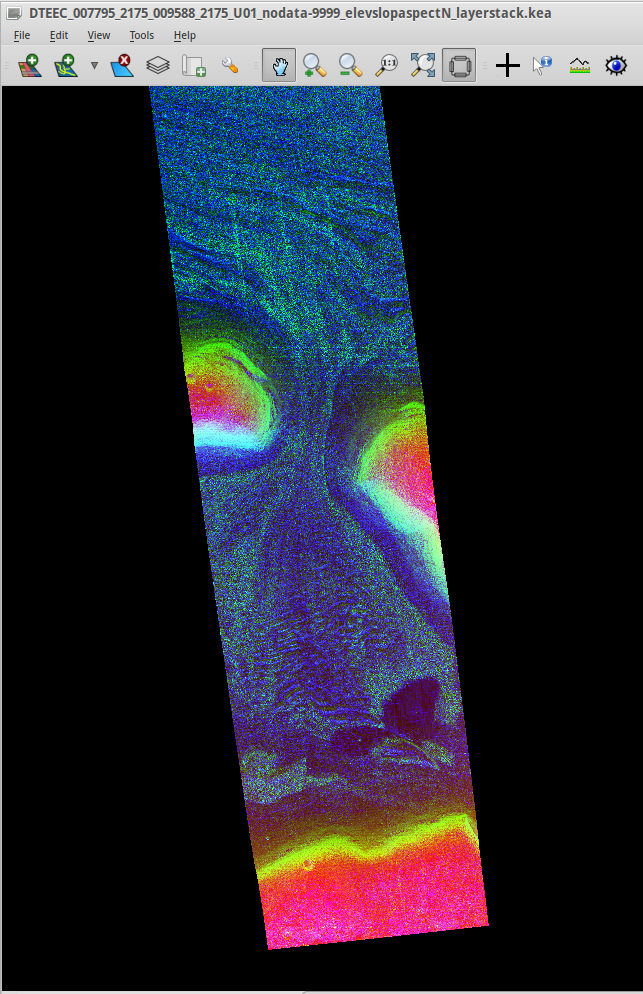
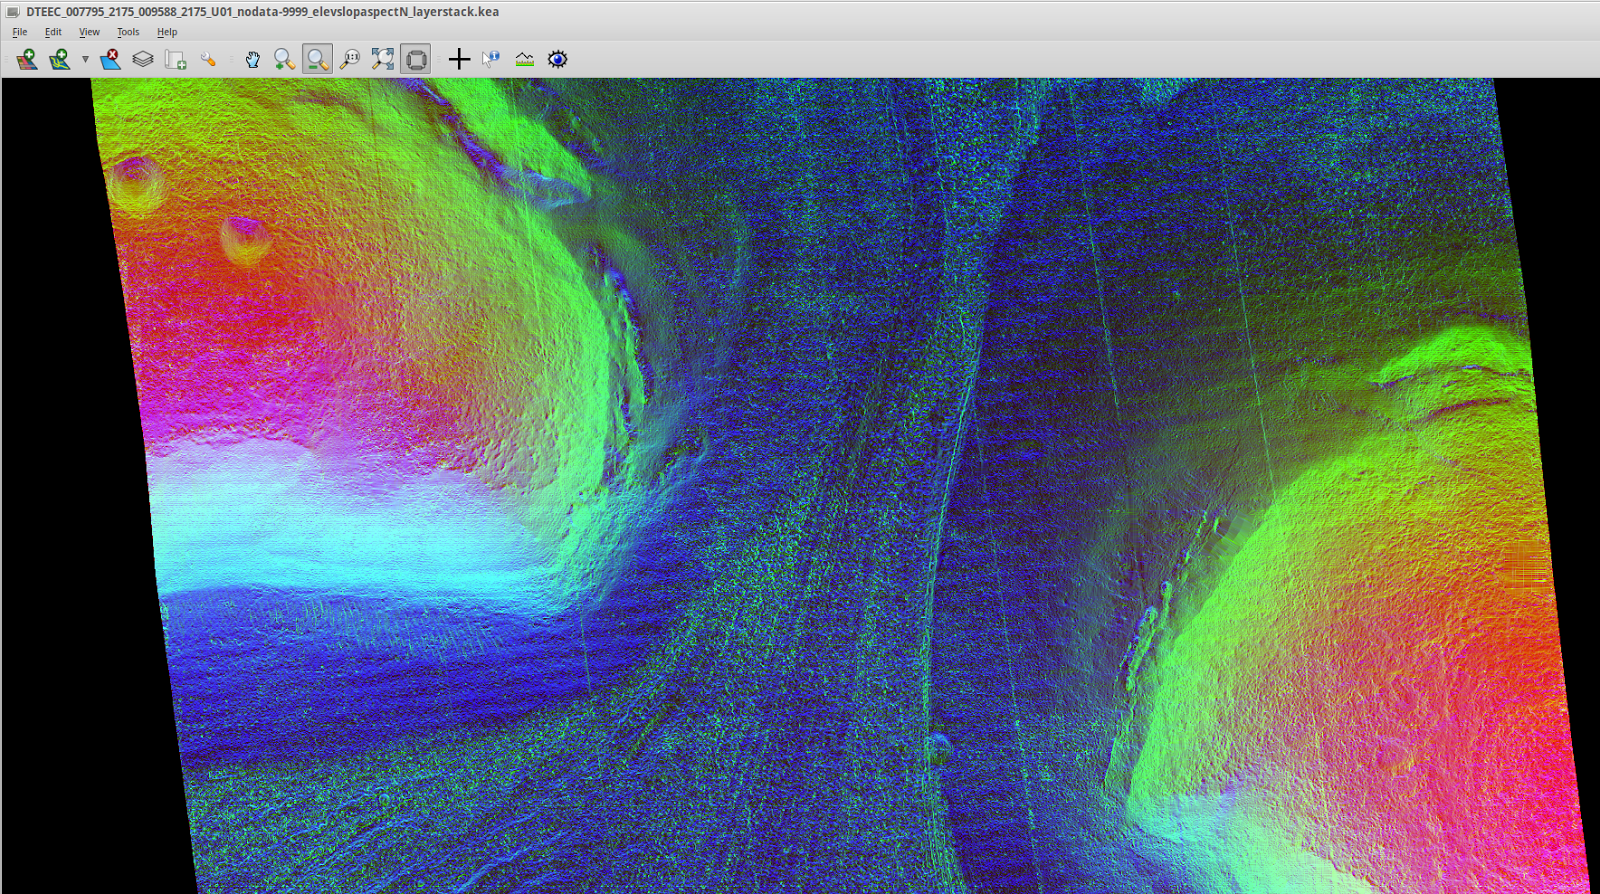
Digital Terrain Model layerstack on Mars
I've begin to look at topographic analysis on Mars. Here's a HiRISE digital terrain model, with red coloured for higher elevations, green for steeper slopes, and blue for aspect.
This one is a Lineated Valley Fill in Deuteronilus Mensae.
Data from HiRISE website (NASA/JPL/University of Arizona/USGS) processed in GDAL and shown in Tuiview.
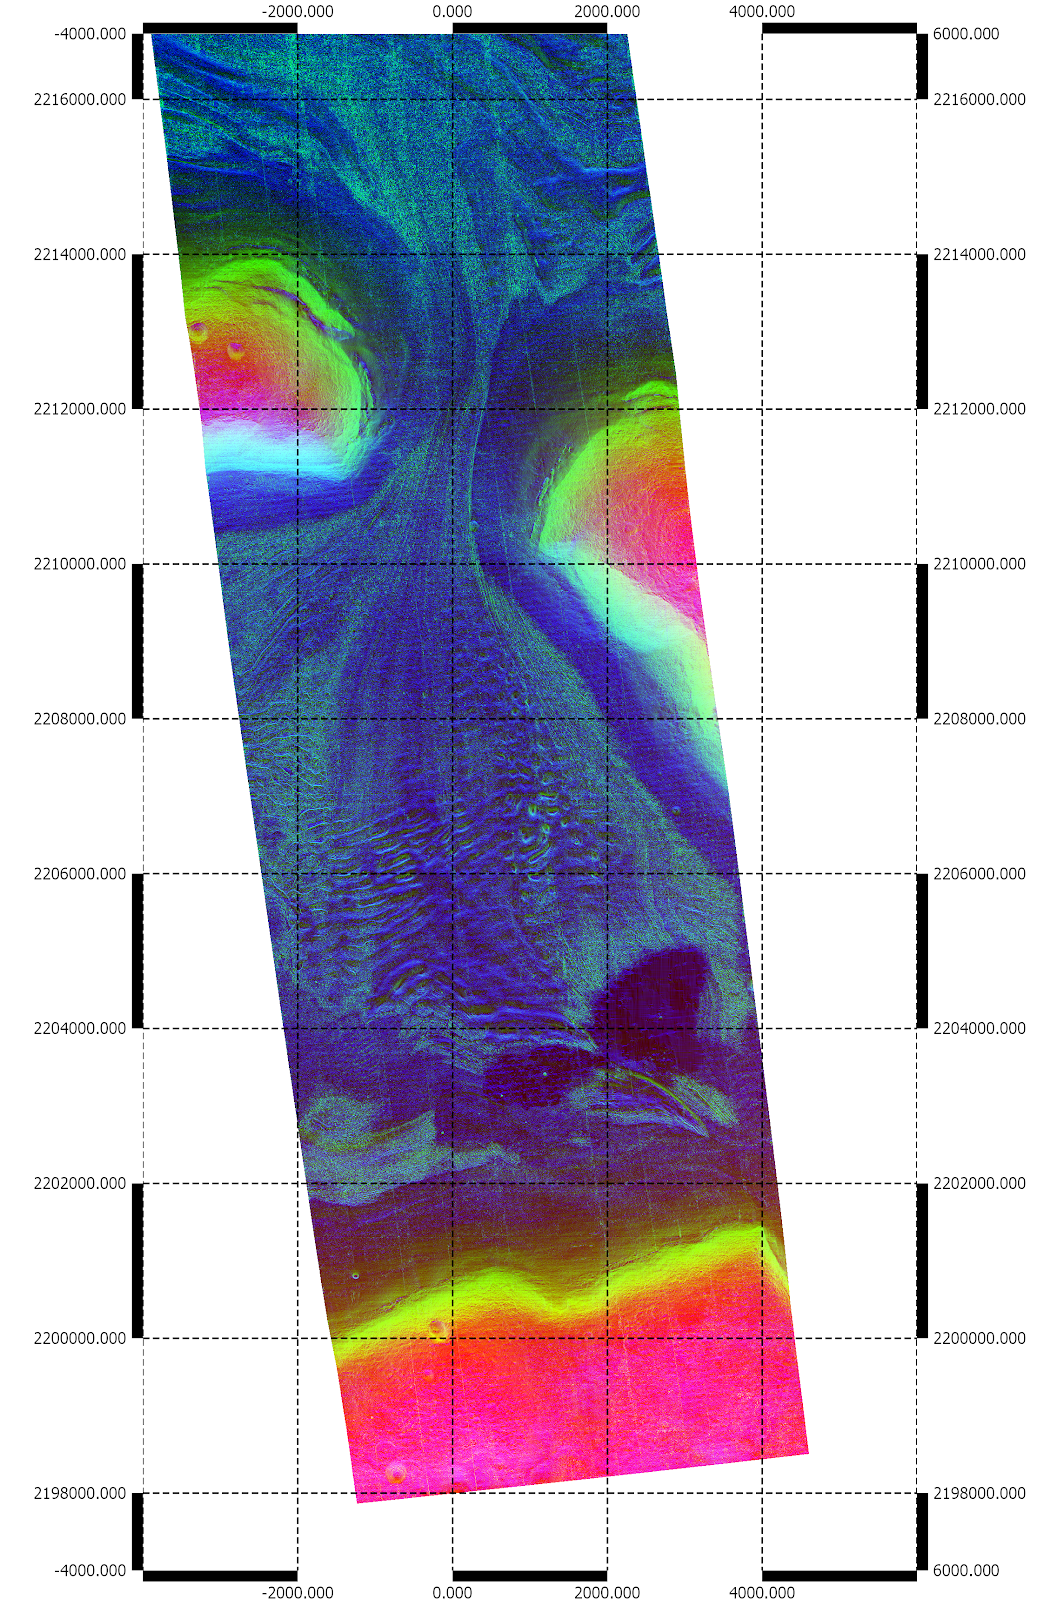
Edit - Importing into QGIS, showing the scale using a grid (units are in metres):
The elevation range is from -2681 to -1997 metres relative to Mars datum, and I've coloured slope in the range 0-30 degrees, and aspect 0-180 deg away from N.
This one is a Lineated Valley Fill in Deuteronilus Mensae.
Data from HiRISE website (NASA/JPL/University of Arizona/USGS) processed in GDAL and shown in Tuiview.
Edit - Importing into QGIS, showing the scale using a grid (units are in metres):
The elevation range is from -2681 to -1997 metres relative to Mars datum, and I've coloured slope in the range 0-30 degrees, and aspect 0-180 deg away from N.
Self-paced Introduction to QGIS and more on DEM segmentation
I have seen recently there is a self-paced course on QGIS from the FOSS4Geo Academy . It is hosted on the open source Canvas Learning Network.
There are two modules so far, an introductory one, and a cartography one, with more coming soon.
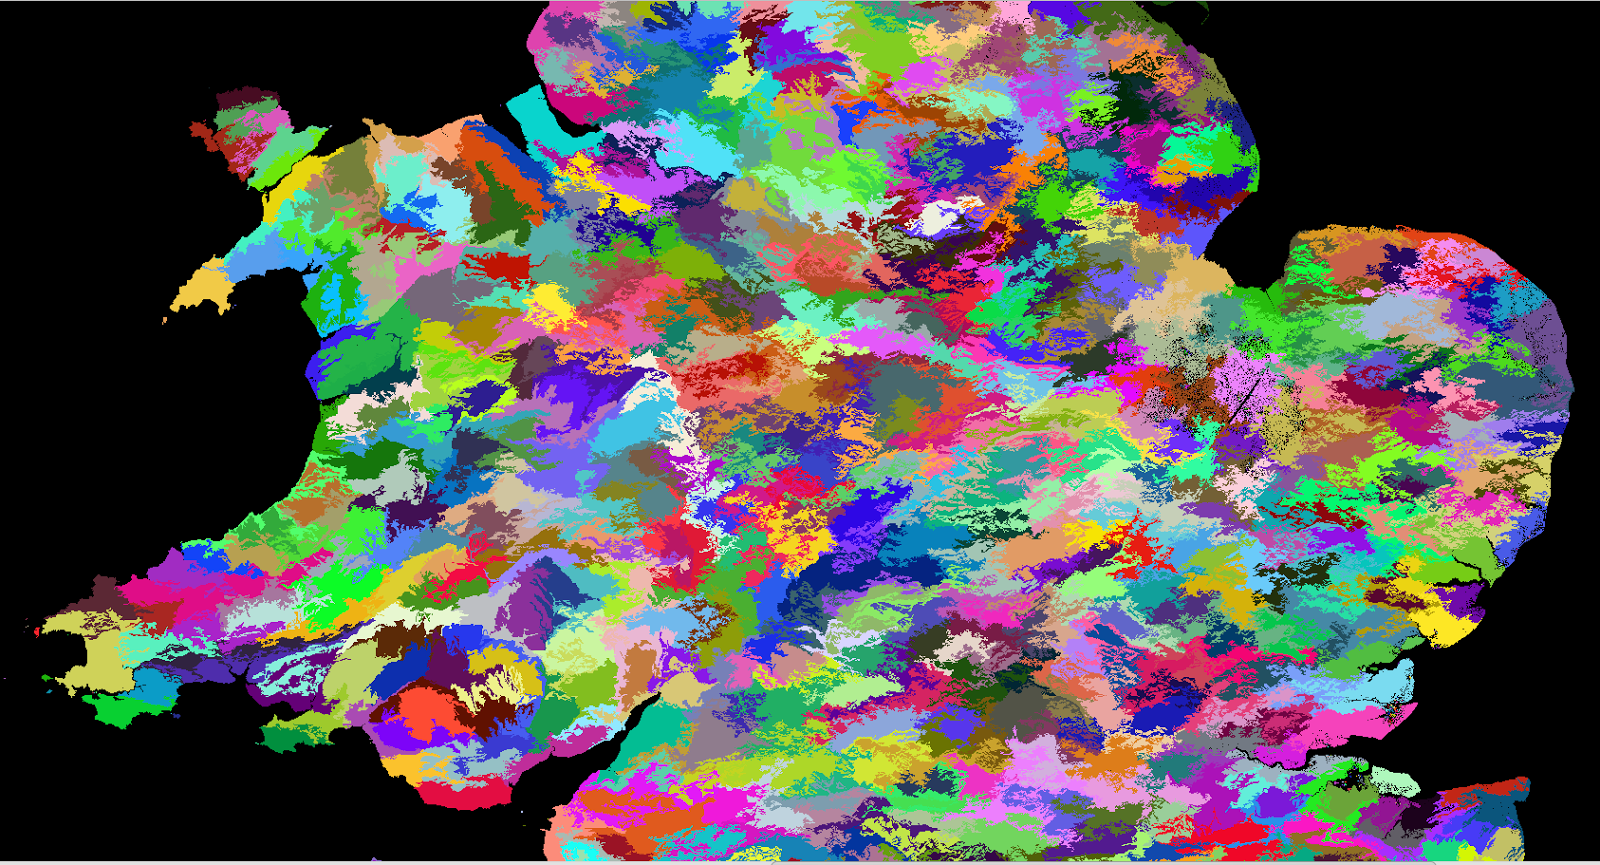
Following on from my last post, here is the topography of the British Isles segmented using RSGISLib using a minimum object size of 65536 pixels.
This probably isn't a useful approach, since it took the computer about 9 hours to do this. I expect it is better to use smaller objects and aggregate them at the classification stage.
Here the mean segments are colourised using yellow for slope, and blue for elevation with a gaussian stretch as before.

And here are the segments with a random colourisation.

Using a higher resolution (5m) DEM for mid-Wales, around the Aberystwyth, Dyfi estuary and Pumlumon area, aggregating to at least 1024 pixels (that is equivalent to a 160x160m square):


There are two modules so far, an introductory one, and a cartography one, with more coming soon.
Following on from my last post, here is the topography of the British Isles segmented using RSGISLib using a minimum object size of 65536 pixels.
This probably isn't a useful approach, since it took the computer about 9 hours to do this. I expect it is better to use smaller objects and aggregate them at the classification stage.
Here the mean segments are colourised using yellow for slope, and blue for elevation with a gaussian stretch as before.
And here are the segments with a random colourisation.
Using a higher resolution (5m) DEM for mid-Wales, around the Aberystwyth, Dyfi estuary and Pumlumon area, aggregating to at least 1024 pixels (that is equivalent to a 160x160m square):
Object-based segmentation of topography with RSGISLib
The RSGISLib (Remote Sensing and GIS) Python library written by Pete Bunting and Daniel Clewley provides a number of features, among them segmentation of images to objects.
This can not only be applied to what one conventionally thinks of as images, but also topographic layers. I thought I'd practice this on Earth first before trying to do this for Mars as I will be for my dissertation.
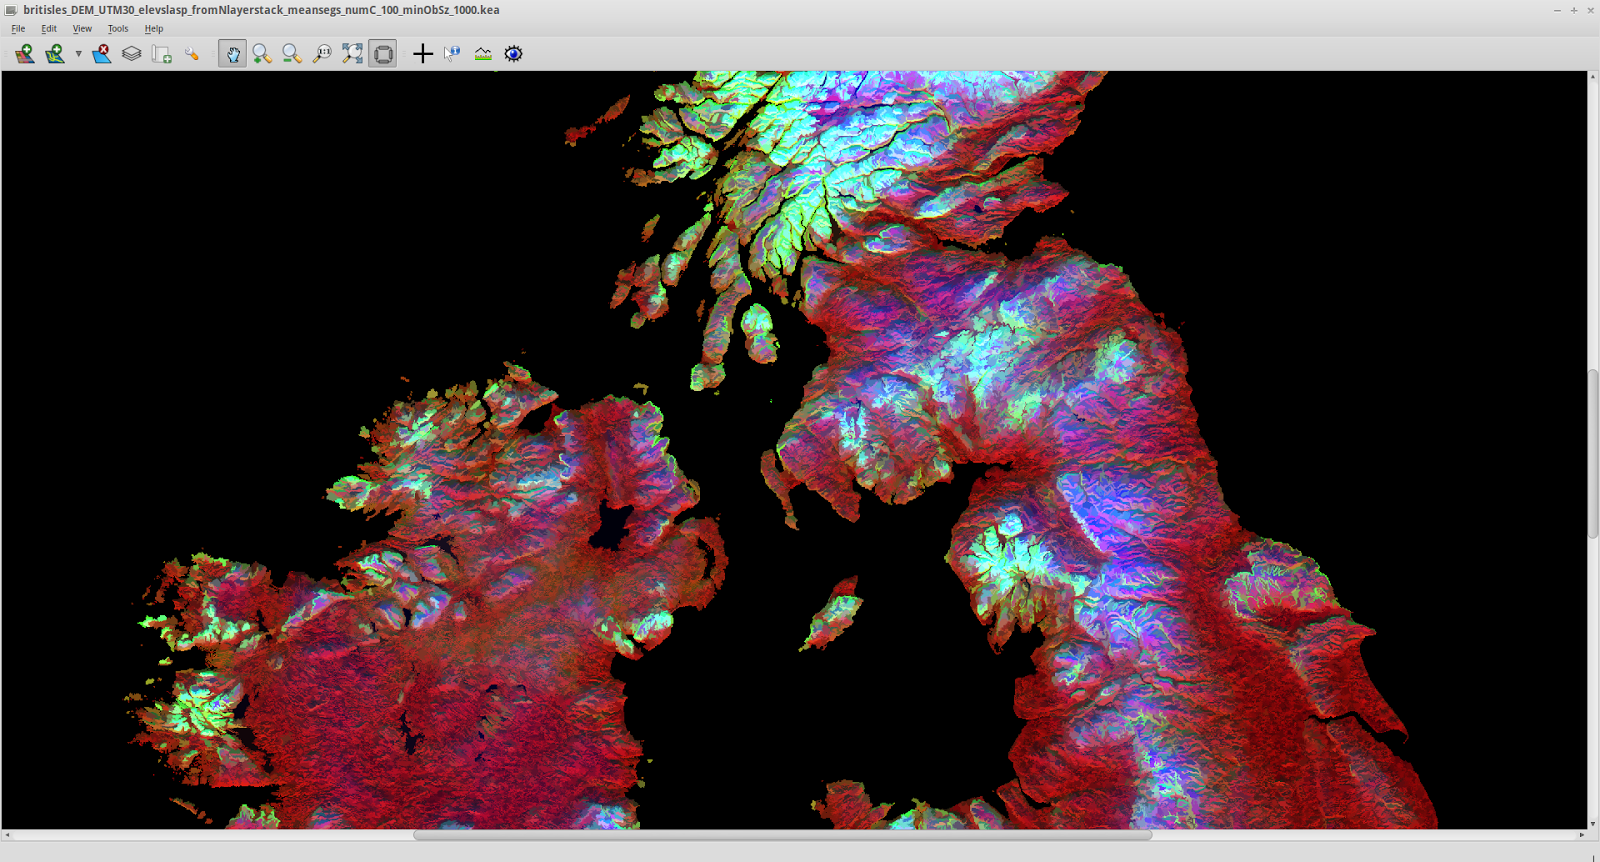
Using Space Shuttle Radar data (freely available - I got it via the program Viking) I obtained the elevation of the British Isles (excluding Shetland) and using GDAL via QGIS and the command line, created slope and aspect layers. I then transformed the aspect to remove the discontinuity at 360-0 deg, using degrees from N, so that 180 is south facing, east and west are both 90 etc.
Using RSGISLib it is possible to segment to objects. Here I show some results of doing so, using a layerstacked image with elevation, slope and angle from N. I have set the minimum connected object size to 1000 pixels. With the topographic data gridded at 73m, this means objects about 5.5 sq. km or larger.
Visualisation is a gaussian stretch in TuiView, setting red to aspect, green to slope, and blue to elevation, showing mean values for each segment.

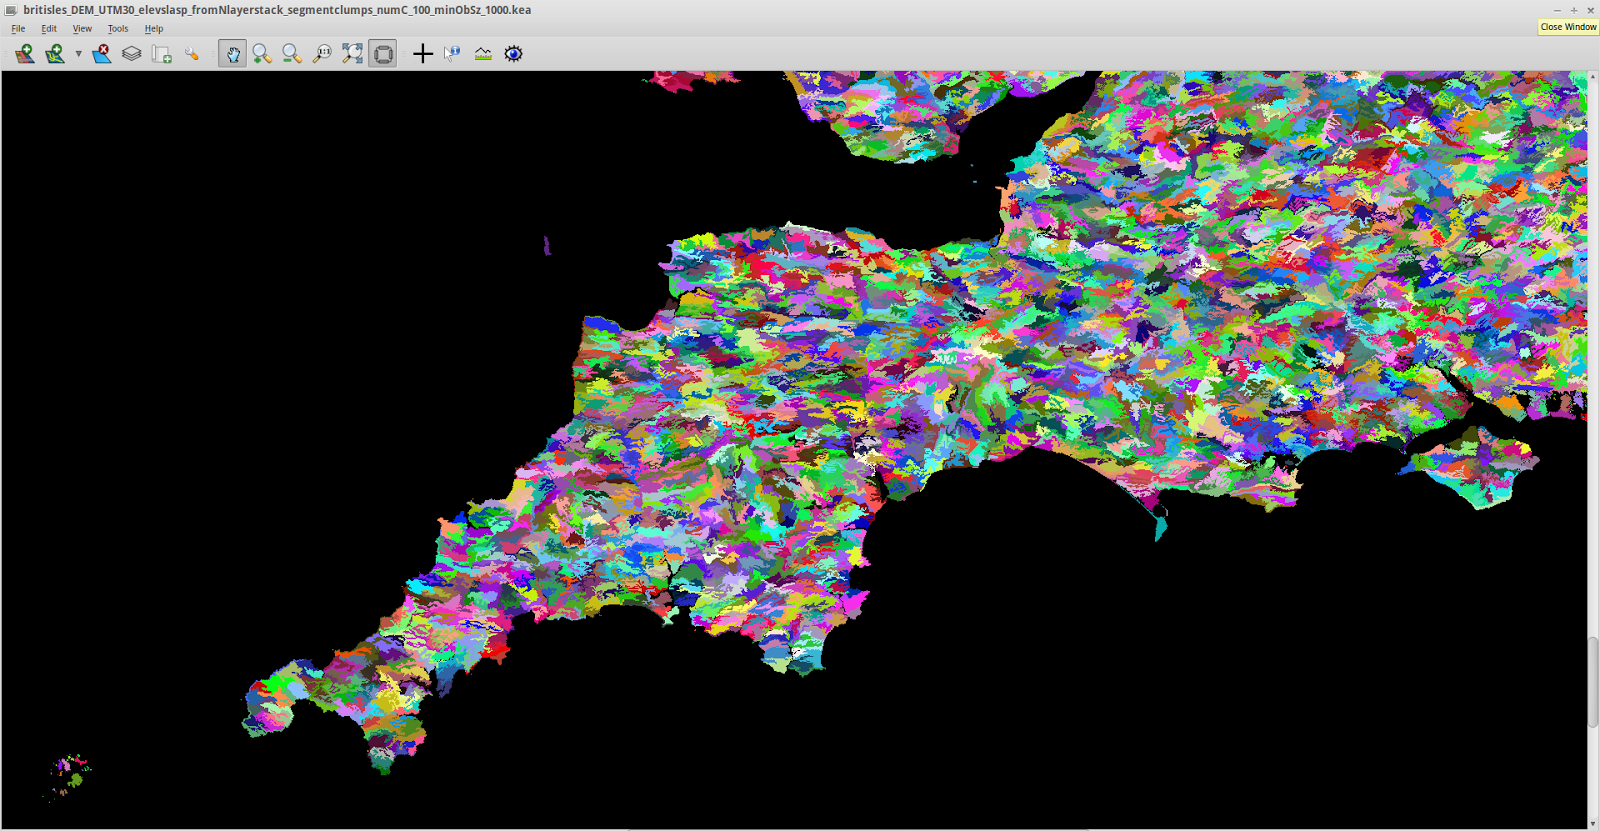
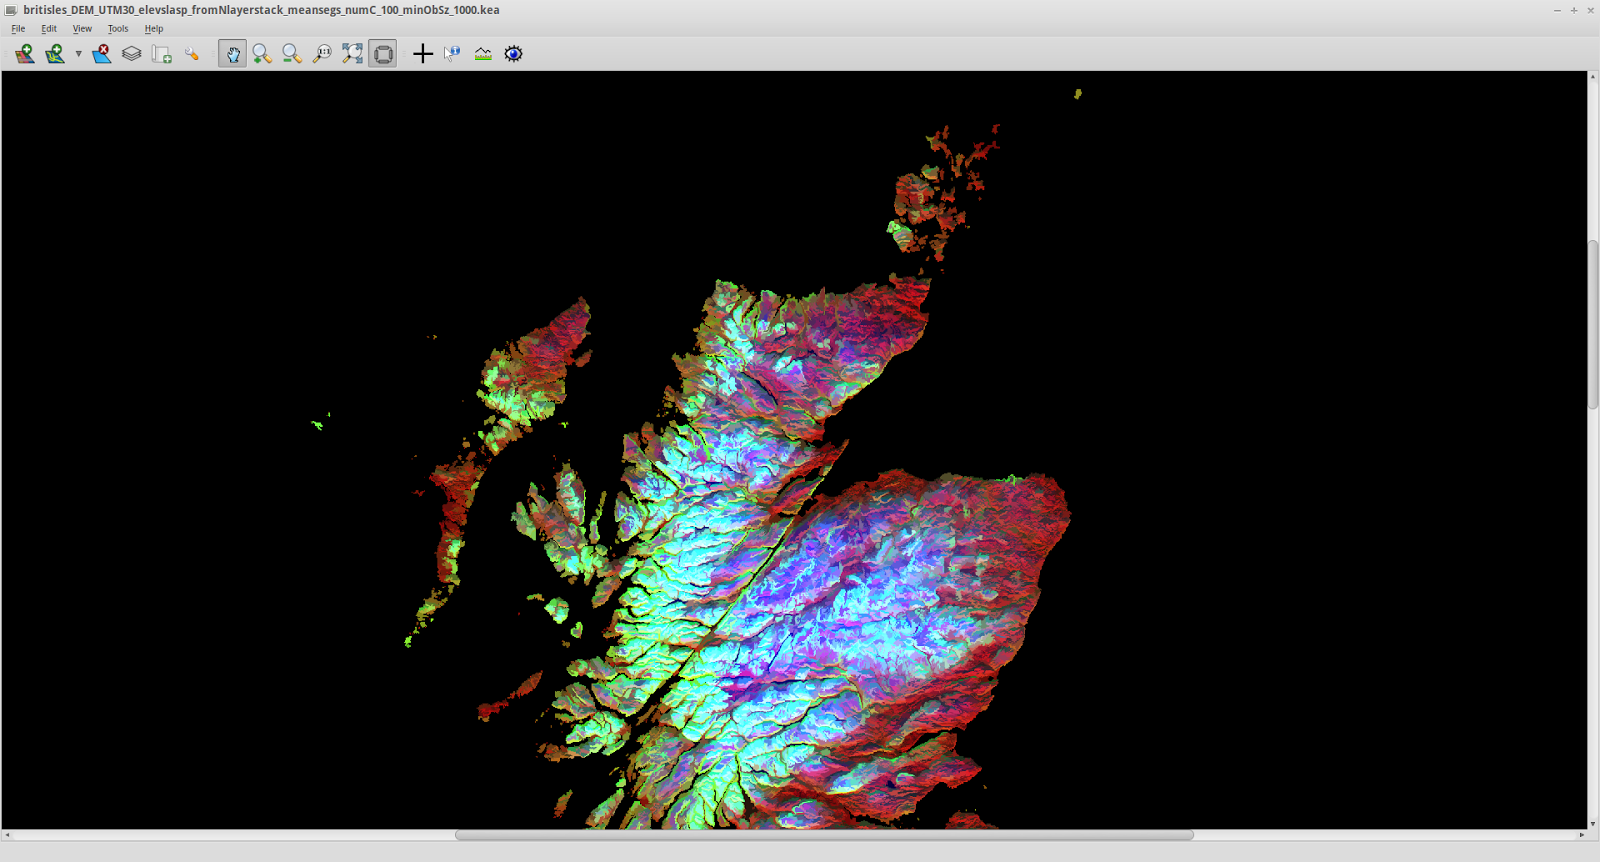 Now I show a few of the actual segments without the values, with colours assigned in RSGISLib for visualisation. It is possible to populate a Raster Attribute Table to add data to the segments for a land cover classification.
From the Isles of Scilly to the Isle of Wight:
 Wales, and central England.
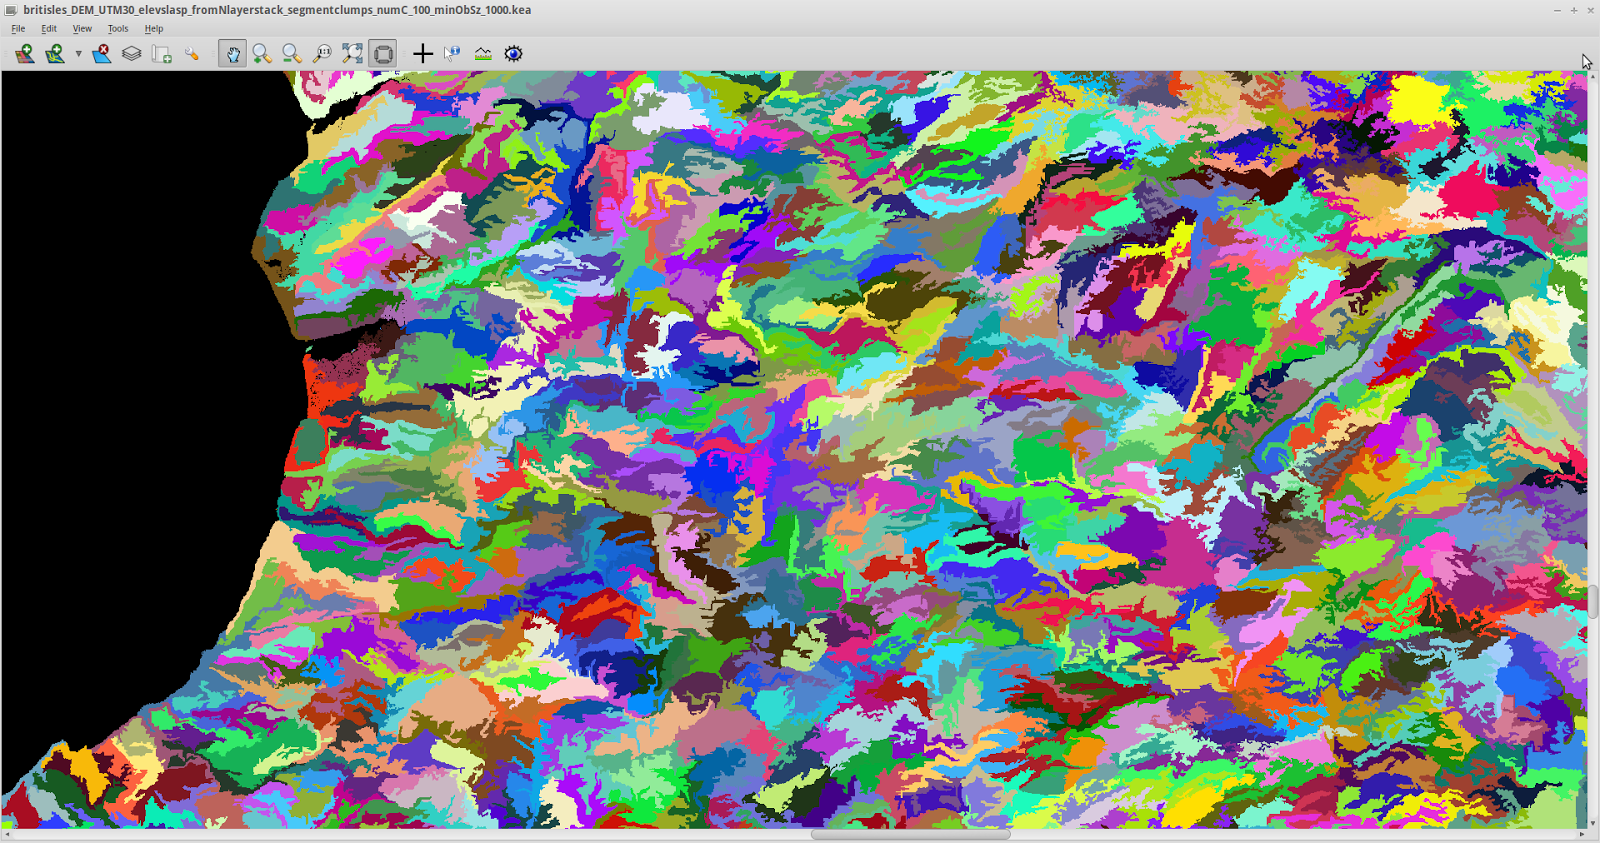
 Zooming in to mid Wales:
By changing the object size, it is possible to do this at different scales. This is part of the segmentation for a minimum object size of 16384 pixels (that is about 89 sq. km) equivalent to a square 9.5km a side:
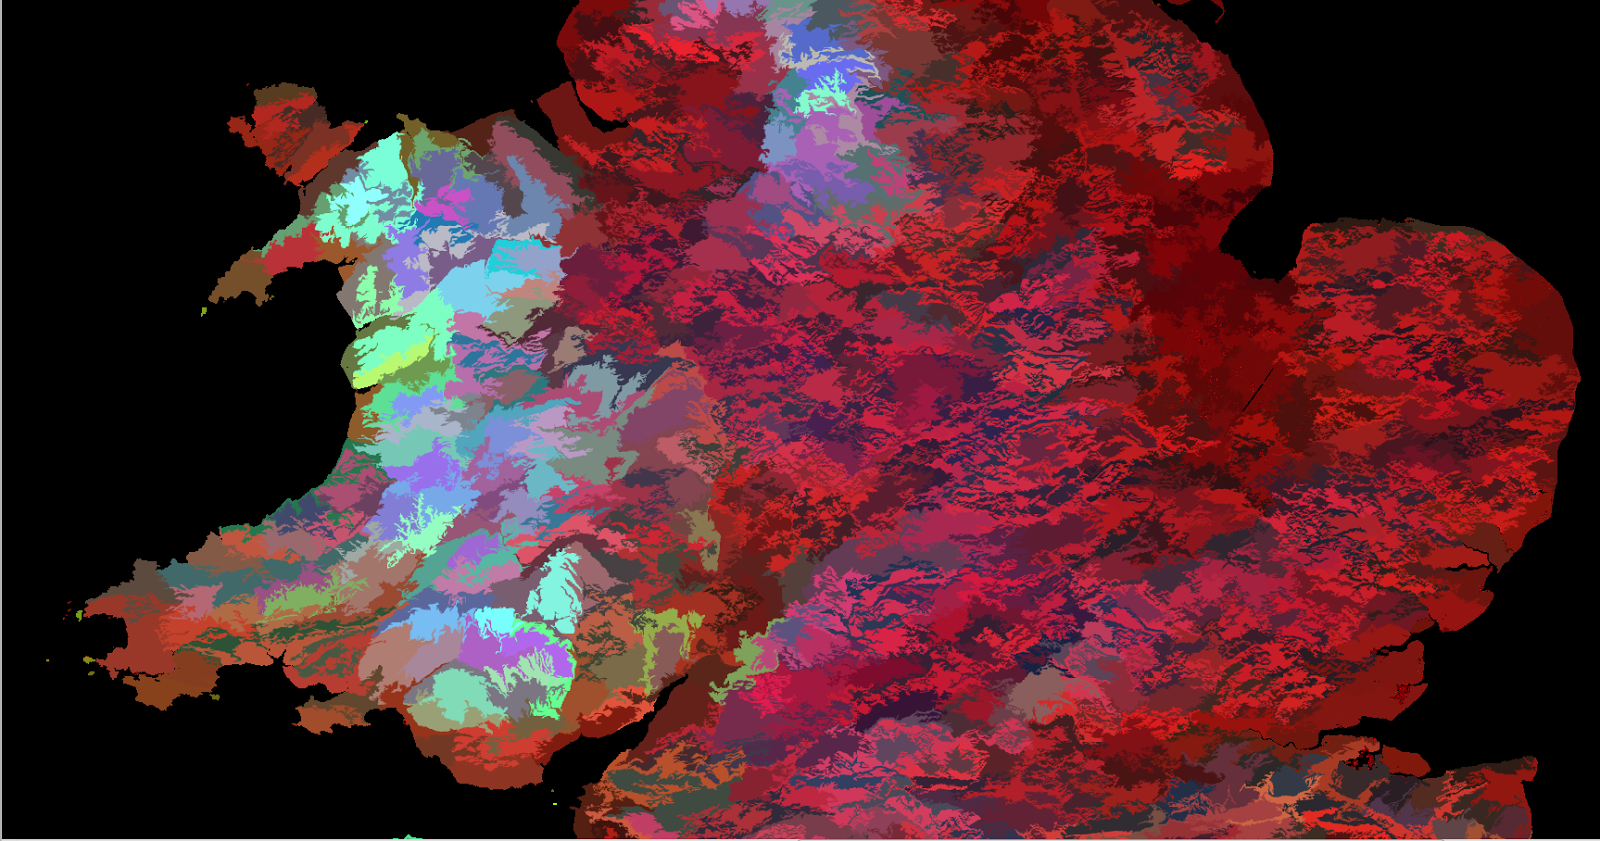
 The thing that makes geospatial data interesting is how what you see in it changes depending on what scale you look at it and how you visualise it.
This can not only be applied to what one conventionally thinks of as images, but also topographic layers. I thought I'd practice this on Earth first before trying to do this for Mars as I will be for my dissertation.
Using Space Shuttle Radar data (freely available - I got it via the program Viking) I obtained the elevation of the British Isles (excluding Shetland) and using GDAL via QGIS and the command line, created slope and aspect layers. I then transformed the aspect to remove the discontinuity at 360-0 deg, using degrees from N, so that 180 is south facing, east and west are both 90 etc.
Using RSGISLib it is possible to segment to objects. Here I show some results of doing so, using a layerstacked image with elevation, slope and angle from N. I have set the minimum connected object size to 1000 pixels. With the topographic data gridded at 73m, this means objects about 5.5 sq. km or larger.
Visualisation is a gaussian stretch in TuiView, setting red to aspect, green to slope, and blue to elevation, showing mean values for each segment.
From the Isles of Scilly to the Isle of Wight:
By changing the object size, it is possible to do this at different scales. This is part of the segmentation for a minimum object size of 16384 pixels (that is about 89 sq. km) equivalent to a square 9.5km a side:
Could Bolster, Cormoran, and Tregeagle be orbiting Saturn someday?
Ever wondered who decides on names for planets, satelites of planets, and features on planets?
Well, it's the International Astronomical Union, and there is a website about it all hosted by the US Geological Survey .
That is the same body that reduced Pluto from being a major planet to a dwarf planet, in the same 2006 decision, the minor planet Ceres got an upgrade to dwarf planet.
There is often a common theme to particular areas, such as many of the moons of Saturn are named after the Titans in Greek mythology. The problem was they discovered many more satellites around Saturn in recent years, and they ran out of Titans.
Therefore the IAU started using giants from other mythologies, grouping the outer irregular satellites by their orbital parameters into the 'Inuit', 'Norse' and 'Gallic' groups, the latter including Albiorix, Erriapus, Tarvos and Bebhionn. Three of these are Gaulish names, although perhaps the IAU considers Gallic and Celtic to be equivalent, since Bebhionn is named after a characted in Irish mythology.
If we discover some more moons, perhaps the Cornish giants Bolster, Cormoran, or Tregeagle will be orbiting Saturn alongside them.
List of Remote Sensing and GIS links
Here is a list of Remote Sensing and GIS links that may be useful and/or interesting:
http://resources.arcgis.com/en/help - Online access to ArcGIS Help.
http://opticks.org - Opticks - free open source image analysis software.
http://www.qgis.org - QGIS project page where you can find the free and open source QGIS software.
http://foss4geo.org - A self-paced course on QGIS from the Free and Open Source Software 4 Geo Academy. There are two modules currently, an introduction and cartography (June 2014) with more coming soon.
http://anitagraser.com - QGIS blog by QGIS developer and data visualisation specialist Anita Graser.
http://infogeoblog.wordpress.com - A GIS blog containing tips and tutorials on QGIS.
http://fromgistors.blogspot.com Blog by Luca Congedo, the author of the Semi-Automatic Classification Plugin for QGIS that allows for supervised Land Cover classifications.
http://gracilis.carleton.ca/CUOSGwiki Carleton University Open Source GIS tutorials.
http://sourceforge.net/apps/mediawiki/viking/index.php?title=Main_Page - Viking: a free and open source program to manage GPS data. This can import data from a GPS device and add map layers from OpenStreetMap and digital elevation model data.
http://www.gislounge.com GIS information portal.
http://www.movable-type.co.uk/scripts/latlong-gridref.html Online converter in Javascript from Lat/Long to OSGB grid references and vice versa.
http://www.ordnancesurvey.co.uk/business-and-government/help-and-support/navigation-technology/os-net/grid-inquest.html Downloadable Grid Inquest software to convert between Lat/long and OSGB grid references. An online batch converter is also available.
http://www.w3schools.eu/2012/07/webgl-essentials-part-i
Tutorial for WebGL. WebGL is an in-browser 3D renderer based on OpenGL, which lets you display your 3D content directly into an HTML5 page.
Python:
http://www.rsgislib.org - Remote Sensing and GIS library: a collection of tools for processing remote sensing and GIS datasets, used via a Python library or XML bindings.
https://bitbucket.org/petebunting/arcsi - ARCSI atmospheric correction software (Python).
http://www.py6s.rtwilson.com - Py6S (Second Simulation of the Satellite Signal in the Solar Spectrum) - a Python library implementing atmospheric correction models.
http://videolectures.net/mloss08_hunter_mat - video lecture on matplotlib (plotting library for Python) by one of its developers (dates from 2008).
a few links from astronomers - some of which may be applicable to remote sensing:
http://python4astronomers.github.io
http://www.astrobetter.com/visualization-fun-with-python-2d-histogram-with-1d-histograms-on-axes
http://geospatialpython.com - Joel Lawhead's Geospatial Python blog.
http://code.google.com/p/pyshp - Python Shapefile library.
http://code.google.com/p/geopy/wiki/GettingStarted geopy - geocoding for python
http://www.gravitystorm.co.uk Website of OSM developer Andy Allan.
http://www.ravenfamily.org/andyg/openstreetmap.htm OSM data with topography of UK and Ireland exported for Garmin GPS units.
www.elsewhere.org/journal/gmaptogpx A Javascript tool to export directions as a GPX file from Google Maps.
http://www.perfilderuta.es/perfil.php?lng=en Draw the elevation profile of your bicycle routes.
http://maps.vlasenko.net Soviet military topographic maps.
http://freegisdata.rtwilson.com - A categorised list of freely available GIS data compiled by Robin Wilson.
http://tools.medialab.sciences-po.fr/iwanthue - Colours for data scientists. Generate and refine palettes of optimally distinct colors.
http://www.jasondavies.com Freelance data visualisation consultant Jason Davies' page.
http://earthobservatory.nasa.gov/blogs/elegantfigures NASA blog on data visualisation.
http://visual.ly Data visualisation online community and blog.
http://www.pheelicks.com/2014/03/rendering-large-terrains An example of rendering a large terrain in 3D using WebGL.
http://www.shadedrelief.com Ideas and Techniques about Relief Presentation on Maps. Includes www.shadedrelief.com/cleantopo2 a cleaned of artifacts topographic and bathymetric dataset for cartographic purposes.
http://datashine.org.uk The DataShine mapping platform from the UCL Centre for Advanced Spatial Analysis. Shows a selection of data from the 2011 England and Wales and Cornwall census. The visualisation clips the output polygons to where there are buildings according to OS Opendata vector maps.
https://support.google.com/fusiontables/answer/184641 - how to use Google Fusion tables to make a visualisation of data on a customized Google Map.
http://www.curriculumkernewek.org.uk/map.html - an example that I did much of the coding for.
http://googlemapsmania.blogspot.co.uk - a lot of interesting things done with maps (warning - procrastination alert!).
http://bigthink.com/blogs/strange-maps - Strange Maps (warning - procrastination alert!)
http://traveltime.propertywide.co.uk similar, allows using different kinds of transport
http://earthexplorer.usgs.gov US geological survey Earth Explorer interface for accessing Landsat (and other) satellite data.
http://landsat.usgs.gov Landsat home page.
http://landsat.gsfc.nasa.gov NASA Landsat Science page.
http://asterweb.jpl.nasa.gov ASTER (Advanced Spaceborne Thermal Emission and Reflection Radiometer) homepage. ASTER is an imaging instrument onboard Terra, the flagship satellite of NASA's Earth Observing System(EOS)
http://www.astrium-geo.com/terrasar-x information on TERRASAR-X (Synthetic aperture radar satellite)
http://www.astrium-geo.com/en/4388-spot-1-to-spot-5-satellite-images
http://www.astrium-geo.com/en/147-spot-6-7-satellite-imagery SPOT 1 to 7 (optical high-resolution multispectral commercially operated satellites).
http://www.esa.int/Our_Activities/Observing_the_Earth/Copernicus The Copernicus programme (previously known as the Global Monitoring for Environment and Security programme (GMES)), including the current and upcoming Sentinel series of earth observation satellites.
http://www.satimagingcorp.com Website of Satellite Imaging Corporation - including information on Worldview series of satellites.
http://www.quantarctica.org - Quantarctica - A collection of datasets focused on Antarctica for use with QGIS.
http://www.ijis.iarc.uaf.edu/cgi-bin/seaice-monitor.cg Arctic Sea-Ice Monitor, by the International Arctic Research Center (IARC) in corporation with the Japan Aerospace Exploration Agency (JAXA) .
http://www.avex-asso.org/dossiers/wordpress/?page_id=2754 A map of (modelled from urbanization) night sky light pollution across Europe. A map of Great Britain can be viewed at http://www.avex-asso.org/dossiers/wordpress/?page_id=127
http://sahultime.monash.edu.au SahulTime is an ongoing project to create a visual, interactive representation of the Earth's history. Observe the geography of Australasia over the last 120,000 years.
http://www.zygrib.org Visualization of weather data. The program can download NOAA (GFS Model) weather forecasts for 8 days ahead for anywhere in the world.
http://www.carbonmap.org - A data visualization project for "Making sense of climate change responsibility and vulnerability", created by Kiln (website with other examples).
http://ode.rsl.wustl.edu PDS Geosciences Node Orbital Data Explorer, covering Mars, the Moon, Mercury and Venus.
http://mars.jpl.nasa.gov Main NASA Mars page.
http://jmars.mars.asu.edu JMARS is an acronym that stands for Java Mission-planning and Analysis for Remote Sensing. It is a geospatial information system (GIS) developed by ASU's Mars Space Flight Facility to provide mission planning and data-analysis tools to NASA's orbiters, instrument team members, students of all ages, and the general public.
http://www.uahirise.org/hiview HiView is a downloadable software tool, the best way to explore HiRISE (the high resolution imaging instrument on NASA's Mars Reconnaissance Orbiter) images of the Martian surface at the full resolution of the imagery.
http://hrscview.fu-berlin.de/cgi-bin/ion-p?page=entry2.ion Freie Universität Berlin web interface to the Mars Express High Resolution Stereo Camera image archive.
http://english.cntv.cn/special/lunarmission/index.shtml information on Chang'e 3 Chinese lunar mission.
http://www.spaceflight101.com/change-3.html information on Chang'e 3 Chinese lunar mission.
http://lunar.gsfc.nasa.gov Lunar Reconnaisance Orbiter homepage.
http://saturn.jpl.nasa.gov NASA Cassini Orbiter page.
http://www.ciclops.org/index.php CICLOPS (Cassini Imaging Central Laboratry for Operations) i.e. optical and near infrared imaging.
http://wwwvims.lpl.arizona.edu Cassini Visual and Infrared Mapping Spectrometer website.
http://locatestreet.com/game.php - similar
http://pursued.nemesys.hu - this one has a time limit.
http://inear.se/urbanjungle - Urban Jungle Street View.
Remote Sensing and GIS software, tutorials etc.
http://spectraldifferences.wordpress.com/about - Dan Clewley's blog on open-source remote sensing software.
http://resources.arcgis.com/en/help - Online access to ArcGIS Help.
http://opticks.org - Opticks - free open source image analysis software.
http://www.qgis.org - QGIS project page where you can find the free and open source QGIS software.
http://foss4geo.org - A self-paced course on QGIS from the Free and Open Source Software 4 Geo Academy. There are two modules currently, an introduction and cartography (June 2014) with more coming soon.
http://anitagraser.com - QGIS blog by QGIS developer and data visualisation specialist Anita Graser.
http://infogeoblog.wordpress.com - A GIS blog containing tips and tutorials on QGIS.
http://fromgistors.blogspot.com Blog by Luca Congedo, the author of the Semi-Automatic Classification Plugin for QGIS that allows for supervised Land Cover classifications.
http://gracilis.carleton.ca/CUOSGwiki Carleton University Open Source GIS tutorials.
http://sourceforge.net/apps/mediawiki/viking/index.php?title=Main_Page - Viking: a free and open source program to manage GPS data. This can import data from a GPS device and add map layers from OpenStreetMap and digital elevation model data.
http://www.gislounge.com GIS information portal.
http://www.movable-type.co.uk/scripts/latlong-gridref.html Online converter in Javascript from Lat/Long to OSGB grid references and vice versa.
http://www.ordnancesurvey.co.uk/business-and-government/help-and-support/navigation-technology/os-net/grid-inquest.html Downloadable Grid Inquest software to convert between Lat/long and OSGB grid references. An online batch converter is also available.
http://www.w3schools.eu/2012/07/webgl-essentials-part-i
Tutorial for WebGL. WebGL is an in-browser 3D renderer based on OpenGL, which lets you display your 3D content directly into an HTML5 page.
Python:
https://www.python.org/doc - The official Python website with online documentation and tutorials.
http://www.rsgislib.org - Remote Sensing and GIS library: a collection of tools for processing remote sensing and GIS datasets, used via a Python library or XML bindings.
https://bitbucket.org/petebunting/arcsi - ARCSI atmospheric correction software (Python).
http://www.py6s.rtwilson.com - Py6S (Second Simulation of the Satellite Signal in the Solar Spectrum) - a Python library implementing atmospheric correction models.
http://videolectures.net/mloss08_hunter_mat - video lecture on matplotlib (plotting library for Python) by one of its developers (dates from 2008).
a few links from astronomers - some of which may be applicable to remote sensing:
http://python4astronomers.github.io
http://www.astrobetter.com/visualization-fun-with-python-2d-histogram-with-1d-histograms-on-axes
http://geospatialpython.com - Joel Lawhead's Geospatial Python blog.
http://code.google.com/p/pyshp - Python Shapefile library.
http://code.google.com/p/geopy/wiki/GettingStarted geopy - geocoding for python
Online Mapping
http://www.openstreetmap.org OpenStreetMap - a free and user-editable online map.
http://www.gravitystorm.co.uk Website of OSM developer Andy Allan.
http://www.ravenfamily.org/andyg/openstreetmap.htm OSM data with topography of UK and Ireland exported for Garmin GPS units.
www.elsewhere.org/journal/gmaptogpx A Javascript tool to export directions as a GPX file from Google Maps.
http://www.perfilderuta.es/perfil.php?lng=en Draw the elevation profile of your bicycle routes.
http://maps.vlasenko.net Soviet military topographic maps.
Downloadable GIS data
http://www.ordnancesurvey.co.uk/business-and-government/products/opendata-products.html UK Ordnance Survey Open Data. Various raster and vector layers are available.
http://freegisdata.rtwilson.com - A categorised list of freely available GIS data compiled by Robin Wilson.
Cartography and Data Visualisation Advice
http://colorbrewer2.org - Colour Palettes, including selecting palettes to reproduce effectively in print, and for colour-blind viewers.
http://tools.medialab.sciences-po.fr/iwanthue - Colours for data scientists. Generate and refine palettes of optimally distinct colors.
http://www.jasondavies.com Freelance data visualisation consultant Jason Davies' page.
http://earthobservatory.nasa.gov/blogs/elegantfigures NASA blog on data visualisation.
http://visual.ly Data visualisation online community and blog.
http://www.pheelicks.com/2014/03/rendering-large-terrains An example of rendering a large terrain in 3D using WebGL.
http://www.shadedrelief.com Ideas and Techniques about Relief Presentation on Maps. Includes www.shadedrelief.com/cleantopo2 a cleaned of artifacts topographic and bathymetric dataset for cartographic purposes.
GIS Data visualisation examples
http://datashine.org.uk The DataShine mapping platform from the UCL Centre for Advanced Spatial Analysis. Shows a selection of data from the 2011 England and Wales and Cornwall census. The visualisation clips the output polygons to where there are buildings according to OS Opendata vector maps.
General Mapping Fun
https://support.google.com/fusiontables/answer/184641 - how to use Google Fusion tables to make a visualisation of data on a customized Google Map.
http://www.curriculumkernewek.org.uk/map.html - an example that I did much of the coding for.
http://googlemapsmania.blogspot.co.uk - a lot of interesting things done with maps (warning - procrastination alert!).
http://bigthink.com/blogs/strange-maps - Strange Maps (warning - procrastination alert!)
Travel time maps
http://property.mapumental.com - find areas within a certain travel time by public transport to a location. This assumes you can walk on water
http://traveltime.propertywide.co.uk similar, allows using different kinds of transport
Remote Sensing data and information on sensors:
http://earthexplorer.usgs.gov US geological survey Earth Explorer interface for accessing Landsat (and other) satellite data.
http://landsat.usgs.gov Landsat home page.
http://landsat.gsfc.nasa.gov NASA Landsat Science page.
http://asterweb.jpl.nasa.gov ASTER (Advanced Spaceborne Thermal Emission and Reflection Radiometer) homepage. ASTER is an imaging instrument onboard Terra, the flagship satellite of NASA's Earth Observing System(EOS)
http://www.astrium-geo.com/terrasar-x information on TERRASAR-X (Synthetic aperture radar satellite)
http://www.astrium-geo.com/en/4388-spot-1-to-spot-5-satellite-images
http://www.astrium-geo.com/en/147-spot-6-7-satellite-imagery SPOT 1 to 7 (optical high-resolution multispectral commercially operated satellites).
http://www.esa.int/Our_Activities/Observing_the_Earth/Copernicus The Copernicus programme (previously known as the Global Monitoring for Environment and Security programme (GMES)), including the current and upcoming Sentinel series of earth observation satellites.
http://www.satimagingcorp.com Website of Satellite Imaging Corporation - including information on Worldview series of satellites.
Earth-based Applications
http://www.renewables-atlas.info - The Atlas of UK Marine Renewable Energy Resources.
http://www.quantarctica.org - Quantarctica - A collection of datasets focused on Antarctica for use with QGIS.
http://www.ijis.iarc.uaf.edu/cgi-bin/seaice-monitor.cg Arctic Sea-Ice Monitor, by the International Arctic Research Center (IARC) in corporation with the Japan Aerospace Exploration Agency (JAXA) .
http://www.avex-asso.org/dossiers/wordpress/?page_id=2754 A map of (modelled from urbanization) night sky light pollution across Europe. A map of Great Britain can be viewed at http://www.avex-asso.org/dossiers/wordpress/?page_id=127
http://sahultime.monash.edu.au SahulTime is an ongoing project to create a visual, interactive representation of the Earth's history. Observe the geography of Australasia over the last 120,000 years.
http://www.zygrib.org Visualization of weather data. The program can download NOAA (GFS Model) weather forecasts for 8 days ahead for anywhere in the world.
http://www.carbonmap.org - A data visualization project for "Making sense of climate change responsibility and vulnerability", created by Kiln (website with other examples).
Planetary Science Applications
http://pds.jpl.nasa.gov NASA Planetary Data System.
http://ode.rsl.wustl.edu PDS Geosciences Node Orbital Data Explorer, covering Mars, the Moon, Mercury and Venus.
http://mars.jpl.nasa.gov Main NASA Mars page.
http://jmars.mars.asu.edu JMARS is an acronym that stands for Java Mission-planning and Analysis for Remote Sensing. It is a geospatial information system (GIS) developed by ASU's Mars Space Flight Facility to provide mission planning and data-analysis tools to NASA's orbiters, instrument team members, students of all ages, and the general public.
http://www.uahirise.org/hiview HiView is a downloadable software tool, the best way to explore HiRISE (the high resolution imaging instrument on NASA's Mars Reconnaissance Orbiter) images of the Martian surface at the full resolution of the imagery.
http://hrscview.fu-berlin.de/cgi-bin/ion-p?page=entry2.ion Freie Universität Berlin web interface to the Mars Express High Resolution Stereo Camera image archive.
http://english.cntv.cn/special/lunarmission/index.shtml information on Chang'e 3 Chinese lunar mission.
http://www.spaceflight101.com/change-3.html information on Chang'e 3 Chinese lunar mission.
http://lunar.gsfc.nasa.gov Lunar Reconnaisance Orbiter homepage.
http://saturn.jpl.nasa.gov NASA Cassini Orbiter page.
http://www.ciclops.org/index.php CICLOPS (Cassini Imaging Central Laboratry for Operations) i.e. optical and near infrared imaging.
http://wwwvims.lpl.arizona.edu Cassini Visual and Infrared Mapping Spectrometer website.
LaTeX (Document processing)
http://www.andy-roberts.net/writing/latex Getting to Grips with LaTeX by Andrew Roberts.
Games
http://geoguessr.com - Geoguessr - Google Street View guess the location game.
http://locatestreet.com/game.php - similar
http://pursued.nemesys.hu - this one has a time limit.
http://inear.se/urbanjungle - Urban Jungle Street View.
« Prev
1
2
3
4
5
6
7
8
9
10
11
12
13
14
15
16
17
18
19
20
21
22
23
24
25
26
27
28
29
30
31
32
33
34
35
36
37
38
39
40
41
42
43
44
45
46
47
Next »