Skrifennow
My blog, imported from Blogger and converted using Jekyll.
« Prev
1
2
3
4
5
6
7
8
9
10
11
12
13
14
15
16
17
18
19
20
21
22
23
24
25
26
27
28
29
30
31
32
33
34
35
36
37
38
39
40
41
42
43
44
45
46
47
Next »
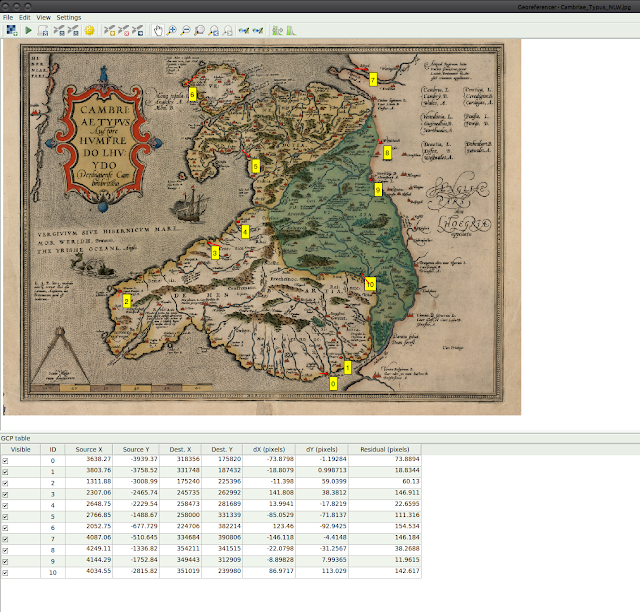
Georeferencing a map from 1574
I saw the National Library of Wales had digitised a map of Wales produced circa 1574 by Humphrey Llwyd, and uploaded a copy to Wikimedia commons.
I decided to try georeferencing it to a modern map based on OpenStreetMap data using the QGIS georeferencer:
I chose a variety of places around Wales and the border areas shown on the map, including Cardiff, Newport, St. Davids, Aberystwyth, Holyhead, Liverpool, Shrewsbury, Hereford.
The result looks more accurate than I expected, with Aberystwyth and Shrewsbury being almost exactly referenced, and several other places with small errors.
According to the author Graham Robb, Whitchurch in Shropshire was the prime longitude meridian for the British Druids in the Iron Age, and is named as "Mediolanum" by Ptolemy in the 2nd century. Aberystwyth (or more exactly, the Pendinas hillfort) was also an important location within their navigation system apparently, being both on a longitude meridian and latitude paralell.
I decided to try georeferencing it to a modern map based on OpenStreetMap data using the QGIS georeferencer:
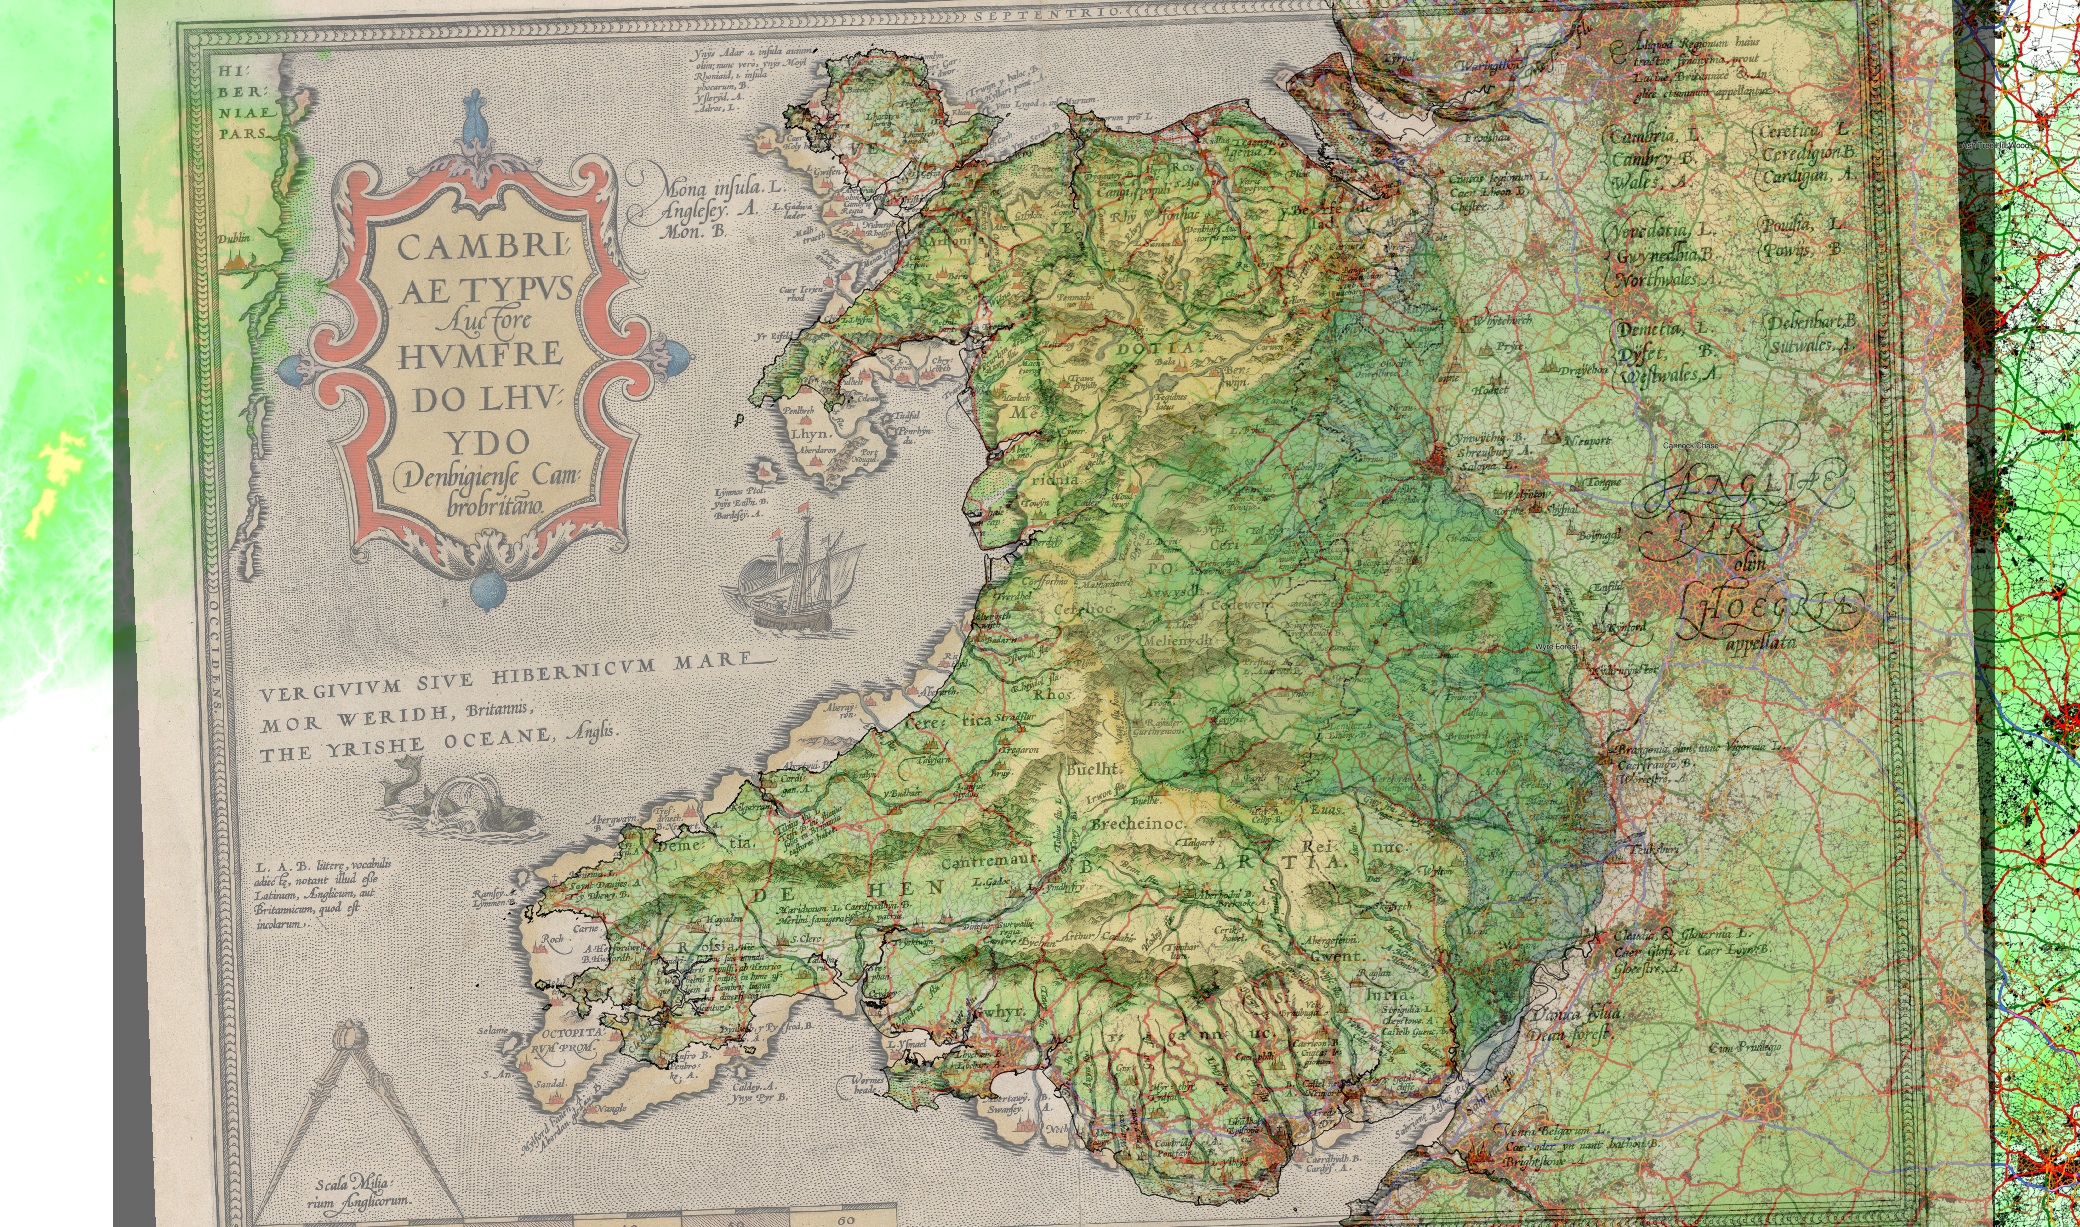
 |
| Overlaying 1574 map with transparency shows the variability in the accuracy of the map. full-size version |
 |
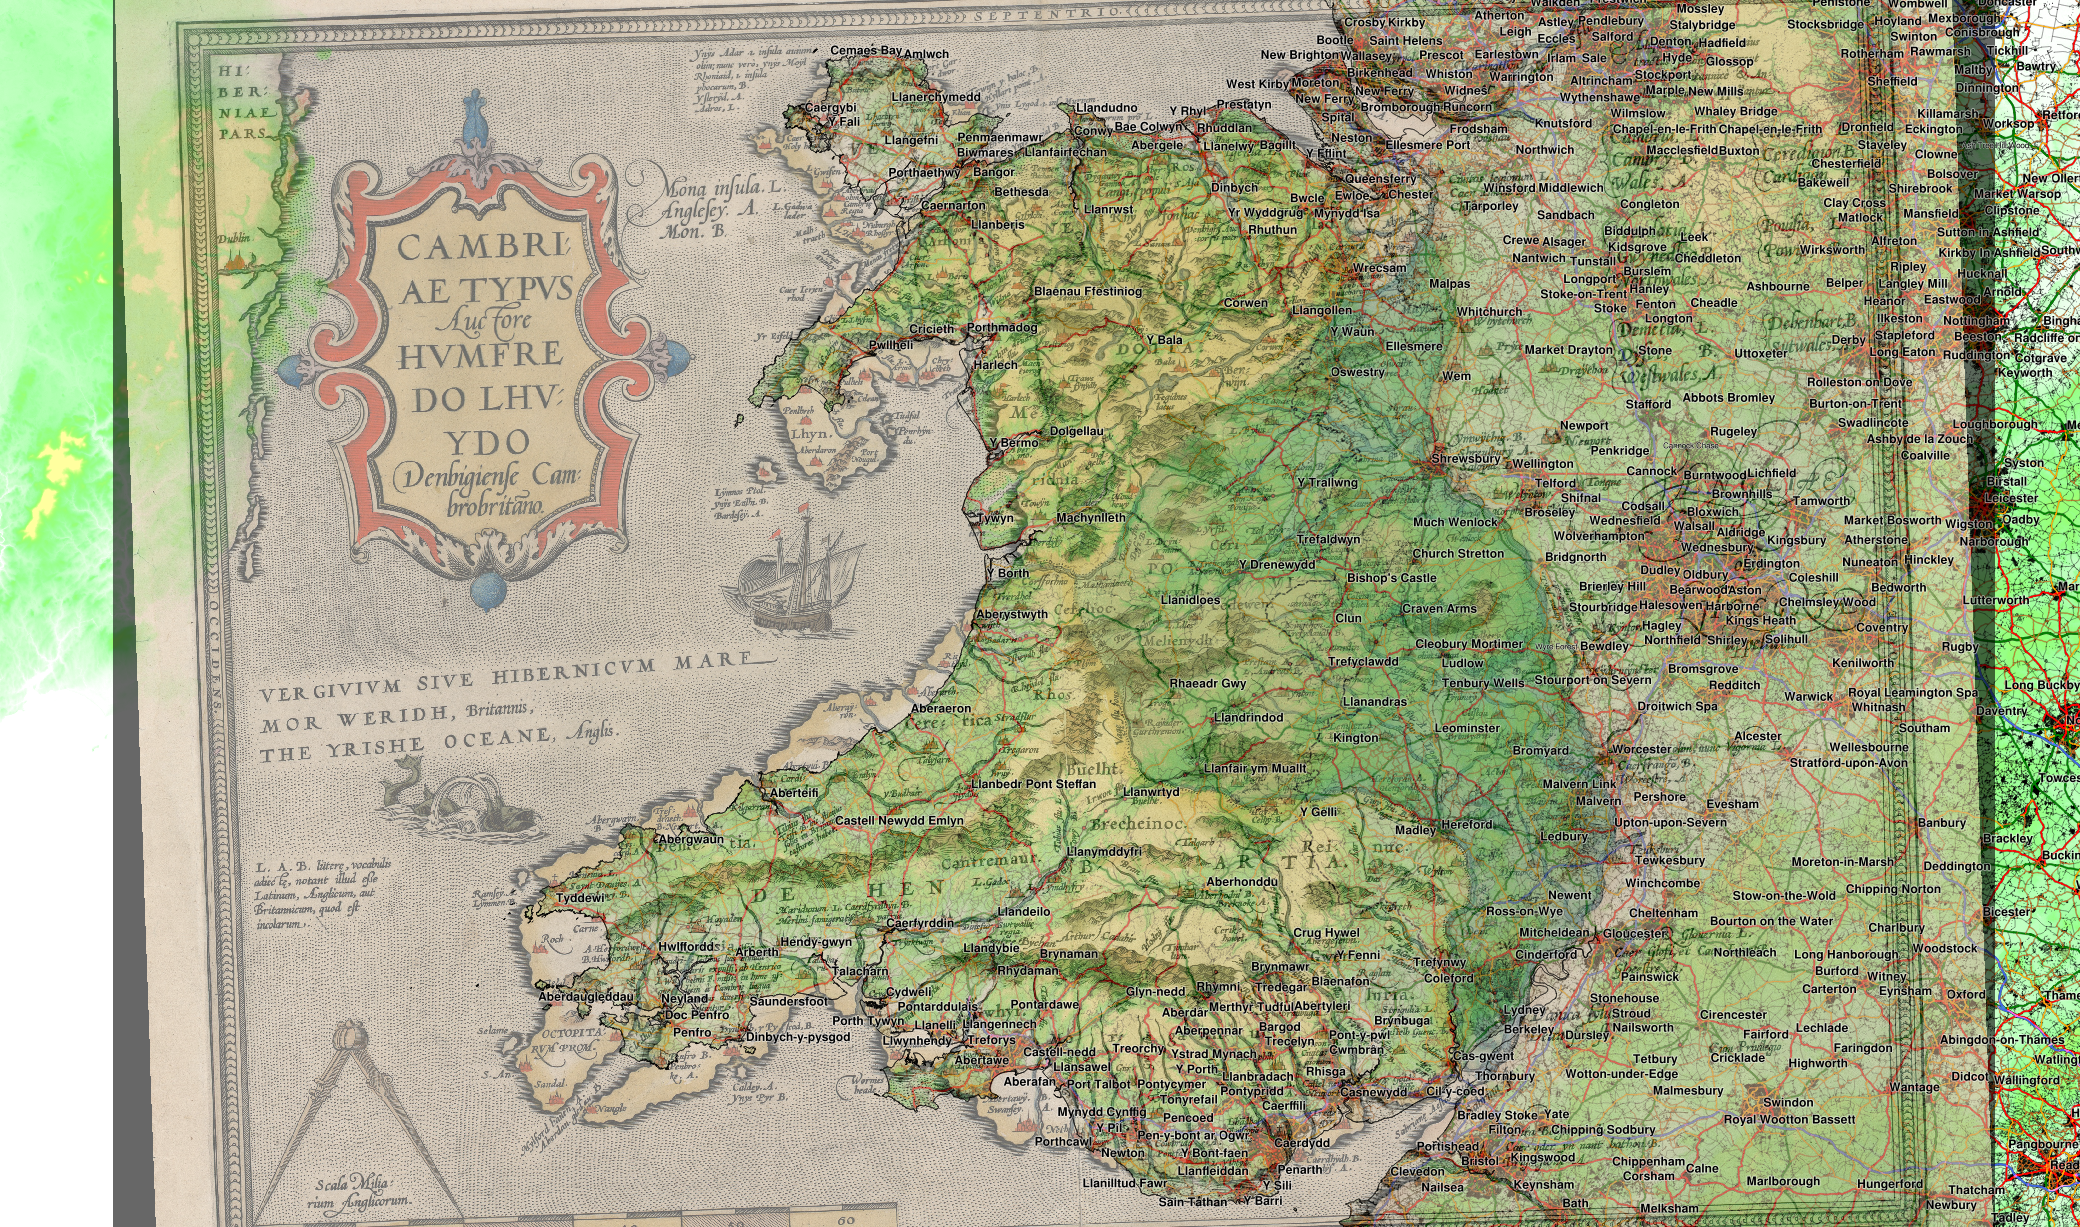
| Removed modern town names to show 1574 map more clearly. full-size version |
I chose a variety of places around Wales and the border areas shown on the map, including Cardiff, Newport, St. Davids, Aberystwyth, Holyhead, Liverpool, Shrewsbury, Hereford.
The result looks more accurate than I expected, with Aberystwyth and Shrewsbury being almost exactly referenced, and several other places with small errors.

According to the author Graham Robb, Whitchurch in Shropshire was the prime longitude meridian for the British Druids in the Iron Age, and is named as "Mediolanum" by Ptolemy in the 2nd century. Aberystwyth (or more exactly, the Pendinas hillfort) was also an important location within their navigation system apparently, being both on a longitude meridian and latitude paralell.
Update: QGIS layer blending
Changing the layer blending method to a "Hard light" overlay rather than semi-transparency makes for a slightly clearer result I think: |
| full-size version |
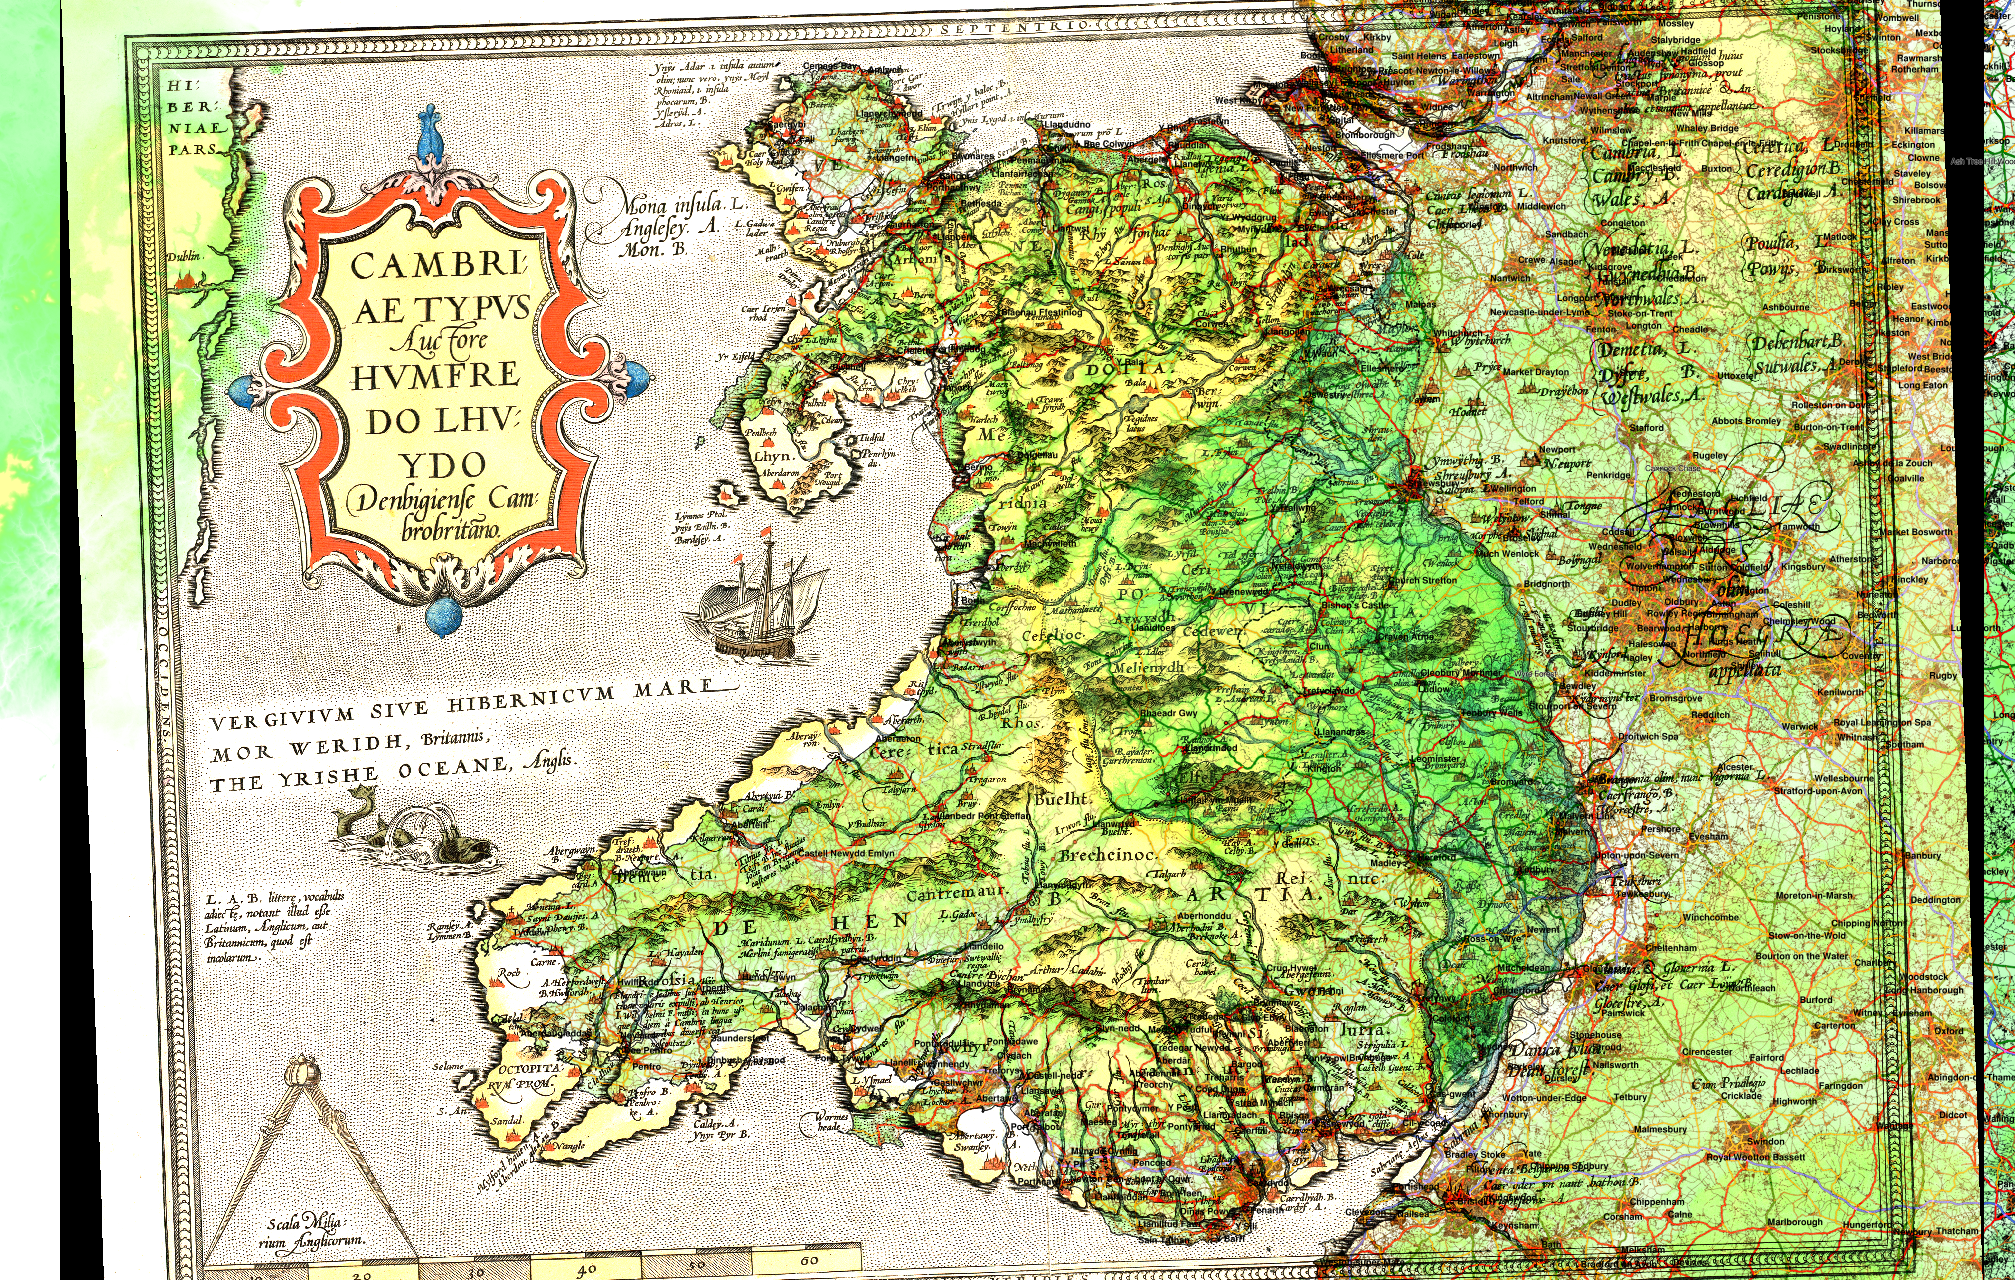
The glacial forms of Greg Crater
As an example, in part of the HRSC tile h2224, Colin Souness in his PhD work found a number of glacial like forms in the northern wall of the crater.
Greg crater is located at 38.5°S, 113.1°E and has a diameter of 66km.
The southern wall of the crater tends to be covered in gullies. There is a detailed summary of it on the website of the Planetary Science Institute, Tucson, based on the W. Hartmann et al paper.
Now looking at the classifier, labelling extent areas above ln(K) > 10 and head areas above ln(K) > 12. I have used "Addition" blending in QGIS to show areas that are classified in both in purple.
There are potential glacier source areas above the Souness objects, but there are many other areas that are also marked out as source areas that do not have glacier like forms catalogued by Souness, such as lower down the north face, the east face and the south face of the central mountain.
Google Earth can be useful to visualise Mars, selecting the CTX image mosaic (the 'context' camera with 6m resolution from Mars Reconnaisance Orbiter):

It is also possible to see where HiRISE coverage exists (red outlines):
Greg crater is located at 38.5°S, 113.1°E and has a diameter of 66km.
 |
| Download larger version |
Now looking at the classifier, labelling extent areas above ln(K) > 10 and head areas above ln(K) > 12. I have used "Addition" blending in QGIS to show areas that are classified in both in purple.
 |
| Download larger version |
 |
| Download larger version |
Google Earth can be useful to visualise Mars, selecting the CTX image mosaic (the 'context' camera with 6m resolution from Mars Reconnaisance Orbiter):

It is also possible to see where HiRISE coverage exists (red outlines):

The Green, Green, QGIS of Mars (Part 2)
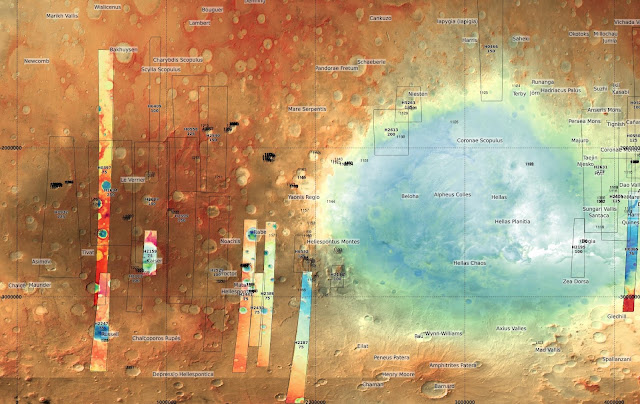
Here is the southern mid-latitudes of Mars, in the same colour scheme as the previous post showing the northern mid-latitudes:
 |
| The lowest elevation area of Mars, the Hellas basin has areas of bright terrain which makes the colour scheme a little confusing. Download larger version. |
The Green, Green, QGIS of Mars
There are many blog posts on the Internet and even scientific papers on the evils of the spectral/rainbow colour palette for continuously varying data.
The series of 6 by Robert Simmon on NASA's Earth Observatory website is particularly worth reading and references many interesting and potentially useful sources.
Incidentally while looking for that, I saw this Image of the Day of a landslide onto a glacier in the Yukon in Canada. I wonder how often they have landslides on Mars.
Thus, I now show you the north of Mars, with the elevation encoded in a single hue palette and again overlaid with "Hard Light" on the Mars Global Surveyor image mosaic.
This will not be perfect for a quantitative visualisation, since it is not possible to distinguish between intrinsically darker areas and areas that are low in elevation.
I choose the green colour, because it leaves red and blue free to plot the classifier function values for areas similar to glacier head and extents.
 |
| The various individual HRSC tiles also have the same kind of colour palette of DTM elevation scaled locally overlaid on the nadir image HRSC. Download a larger image of this here. |
If there's a North there must be a South
See also previous post for the North.
Here is the southern hemisphere of Mars. Again, I have used the same equirectangular coordinates optimised for 40° latitude.
The Souness et al. glacier like forms (such as QGIS plots them at this scale) are marked and numbered.


Here is the southern hemisphere of Mars. Again, I have used the same equirectangular coordinates optimised for 40° latitude.
The Souness et al. glacier like forms (such as QGIS plots them at this scale) are marked and numbered.


« Prev
1
2
3
4
5
6
7
8
9
10
11
12
13
14
15
16
17
18
19
20
21
22
23
24
25
26
27
28
29
30
31
32
33
34
35
36
37
38
39
40
41
42
43
44
45
46
47
Next »